
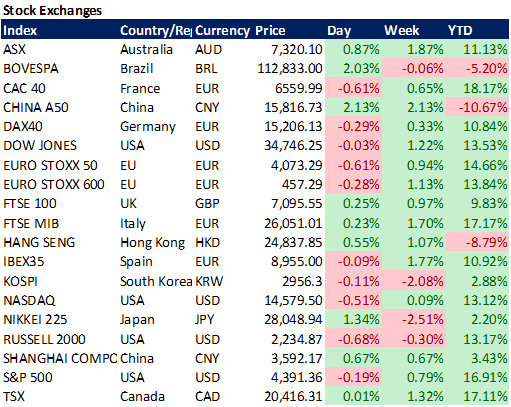
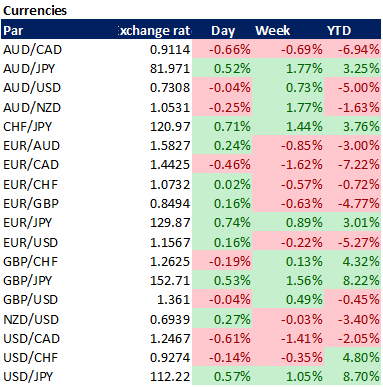
Weekly performance:


Key takeaways:
Economic calendar. 18 trading days to go until Nov 3rd Fed taper. US CPI data; China’s Imports & Exports; UK Manufacturing Production; ZEW Economic Sentiment data, among others, expected to be announced throughout the week.
Macroeconomic outlook. Low employment data combined with increasing hourly wages reinforce the stagflation thesis. Manheim Used Vehicle Value Index >40% YTD. Rotation from QE-winners to QE-losers has begun. US Senate Votes 61-38 to advance debt limit increase legislation.
Equities. Energy and financial sectors, the two most outperforming sectors. Eurozone banks likely to outperform the Euro Stoxx 50, given a higher sensitivity to 10Y Bund yields.
Energy crisis. More than half of the Chinese provinces currently under electricity use limitations. Uncertainty on the prices of raw materials is making industrial plants in Europe to raise red flags: Prices and/or quantities in Q1’22 are not guaranteed.
Currencies. USD to benefit from a weakening credit impulse. USD/EUR an attractive risk-reward trade.
Fixed Income. Reserve Bank of New Zealand hiked interest rates for the first time in seven years. UK 2Y Gilts’ back to 0.5% yield since February 2020, pricing a sooner than expected rate hikes.
Emerging Markets. Chinese stock exchanges opened again after the National Golden Week Holiday. Evergrande’s contagion keeps increasing as Fantasia, another Chinese real estate developer missed debt payments. Two of its bonds suspended from trading.
Commodities. Brent Oil hits $80 per barrel. Natural gas +120% YTD, despite slight correction throughout the week.
18 trading days until Fed Taper, stagflation, banks progressively hiking rates, stimulus progressively fading away…
The countdown to the Fed Taper on November 3rd has led investors to prepare their portfolios for a progressive reduction in liquidity as $30tn of emergency policy stimulus is likely to be wiped out. Said in other words, a clear rotation from QE-winners to QE-losers has already started*.
*QE-winners: High-yield, Large cap, US equities, Selling VIX, Tech & Discretionary sectors, USD.
*QE-losers: Small-cap, Cash, Energy & Utilities, Buying VIX, Commodities, Emerging Markets, Financials, Central Bank Digital Currencies.
Last Wednesday the Reserve Bank of New Zealand announced their decision to hike interest rates by 25 basis points in response to increasing inflationary pressures and an overheated housing market. Despite Kiwis have rapidly recovered, labour and goods shortages are driving inflation up as a by-product of borders remaining closed as a result of the recent Delta variant outbreaks, something which leaves the door open to further 25-bp rate hikes. Other countries namely Norway, South Korea and the Czech Republic have already raised rates (See Graph 1).

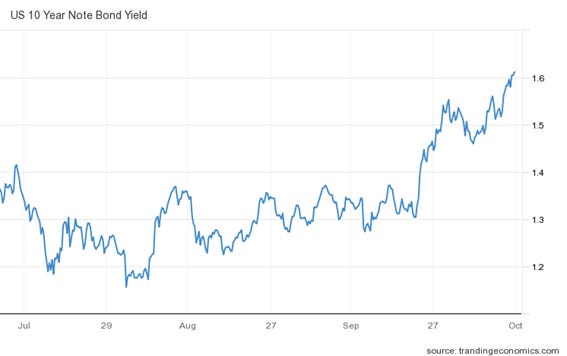
As we can see on Graph 2, the UK 2Y government bond yields hit their highest since February 2020, one month before the coronavirus pandemic hit the country. This recent increase shows the market conviction that it may be a matter of time before the BoE hikes interest rates. Similarly, the US 10Y Treasury (Refer to Graph 3), reflect the global macroeconomic hostility by increasing yields (1.60%). As a matter of fact, the price of the 10Y has lost the 200SMA, and remains extremely bearish. Recall price and yield do have an inverse relationship.

On Thursday, Europe was significantly affected by the release of the Germany Industrial Production data. From the Graph 4 attached below, industrial production in Germany fell 4% MoM in August 2021 (0.4% forecast) mainly as a result of the bottlenecks the automotive sector is currently experiencing.

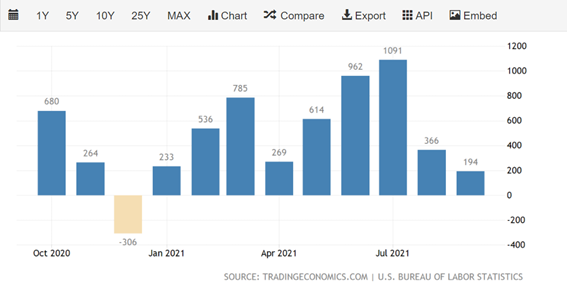
Friday US Senate voted 61-38 to advance debt limit increase. Moreover, employment data was also released on Friday, and, as usual, it played a crucial role in the financial markets’ performance. As we can see in the US Non-farm payrolls (See graph 5), 194,000 jobs have been added on September 2021, the lowest in 2021 and well below forecasts of 500,000. When it comes to the private non-farm payrolls (See graph 6), these have increased by 317,000 on September 2021. (455,000 expected). Manufacturing payrolls increased by 26,000 in September 2021, the lowest since April 2021. Unlike the non-farm payrolls, forecasts have been beaten by 1,000. (See Graph 7)


Similarly, the unemployment rate in September dropped by 0.4% to 4.8%, beating expectations by 0.3%. It is worth mentioning that it has been the lowest unemployment rate since March 2020. Nevertheless, jobless rate still remains above pre-covid levels (≈3.5%). (See graph 8)

All these data reinforce the stagflation thesis. By having a look at the average US private nonfarm payrolls hourly earnings (See Graph 9), they rose to 0.6 (+19% MoM), suggesting that the rising demand for labour as a result of the pandemic recovery has put upward pressure on wages. While equities initially positively discounted these data by associating it to a lower chance of tapering, they then discounted the FED will put price stability at the top of the agenda, even if this implies sacrificing growth. Hence, this last increase in average hourly earnings cements the non-transitionary inflation rise, and consequently, chances are FED remains committed to its previously disclosed tapering scheme.

Another important component when measuring inflation is the used vehicles’ price. By having a look at the Manheim Used Vehicle Value Index (Graph 10), we can see how the price of these has been parabolic, accounting for a 200% increase (+43% since early 2020). This suggests that what it was thought to be a “transitory” component is actually being converted into a permanent one, as semiconductors’ shortage leads to 3–6-month delays in the car selling process, and as a result, people are left no choice but to opt for buying on the secondary market.

Brent Crude Oil gaining momentum, energy crisis exacerbates.
Undoubtedly, the chart of the week is that of the Brent Crude Oil (See Graph 11). Accounting for a 4.11% increase throughout the week and almost 60% YTD, the black gold keeps its momentum by reaching the $80 USD/barrel milestone. Like its peers, JPMorgan remains bullish on oil, stating there is every likelihood that the improvement in the COVID situation will drive a cyclical recovery for the next months. They also believe that the most likely outcome of the current energy crisis is an increase in production at significantly higher energy prices, something which would stabilize the global economy and energy infrastructure. Yet, this would take its toll by temporarily slowing down the energy transition. They concluded the paper by attributing coal as the “canary in a coal mine” for higher oil prices as the evolution of coal prices might reflect supply, demand, cost of capital and energy transitioning issues for all fossil fuels, ultimately oil following the same pattern (around $150-$200).

Bank of America has also updated its views on Crude Oil WTI, suggesting that oil shocks have almost always occurred during stagflation periods. In line with JPMorgan, among others, they remain bullish on WTI, predicting a bull run for the next months. (See Graph 12)

If we have a look at Graph 13, we can appreciate the evolution of the commitment of traders (CoT) for WTI since 2017. CoT is weekly published and shows the position of several participants in the US futures market. Last week US crude production accounted for 11.3 million (+200,000) barrels per day; crude imports rose to seven thousand barrels per day; refinery utilization rose 1.5% to 89.6%. Despite being on a 2-week low, the current bullish channel should generate increasing buying interest.

Another clear sign of the strong momentum of oil is the extreme outperformance of the Saudi Arabia stock market. Accounting for +33% YTD, the Tadawul All Share Index (TASI) has reached a new high since 2001, suggesting the energy shock may not be over yet.
The Old Continent, and especially Germany remains unable to cope with the decreasing inventories of natural gas, expected to be close to zero by mid-March 2022 unless the pattern reversed (Refer to Graph 14). According to Nordea, the primary cause of this negative shock is the Germany’s rapid move away from nuclear electricity, leading to a change in the input mix since the launch of the so-called “Energiewende” in late 2010. Consequently, this has created a stronger dependency on the European electricity grid, requiring double infrastructure to avoid collapse in case of emergency. On top of that, wind farms have produced 30-40% less electricity YTD which, combined with the distressed supply chain, has propelled input prices of natural gas, coal and oil up. Chances are public budget be hugely affected to cope with this energy crisis and ultimately, it will test how much can the society cope with increasing prices to preserve climate change.

Inflationary pressure is also affecting China as input prices of services enterprises kept increasing for the 15th straight month in September and at a faster pace than the previous month. According to Wang Zhe, a senior economist at Caixin Insight Group, while this increase was attributed to rising labour, freight and raw materials costs, it was partly mitigated by the strong consumer demand. By having a look at Graph 15, we can see how three out of every four Chinese provinces are currently limiting electricity use. UBS advised that there may be a 30% slowdown in activity in the most-energy intense sectors, namely steel, chemicals and cement making as a result of a 10-15% cut in overall industrial power in November and December.

Freight Rates between China and the US alleviate, still high
The cost of shipping between the US and China decreased 16% this week after peaking some weeks ago (See Graphs 16 and 17). The reason for this drop has been the shortage of coal in China, which has caused power outages and factory output has been affected. Nevertheless, the spot price is still much higher than what it used to be pre-covid. While the boom in demand will likely continue for the next months, chances are the situation will normalize by mid-2022.


USD, the winning horse
Macroeconomic environment suggests the USD to be a winning horse compared to its peers. Having peaked at 7% of GDP (biggest since 2005), credit impulse is starting to weaken as liquidity facilities are not as needed. Generally, a slowing credit impulse is a synonym of overweighting defensives, flattening yield curve, lower commodities, higher USD/EUR. Combined with the current energy crisis, the scenario could not be more bullish for the USD. It is worth mentioning that the US is the less affected from the G3 (China, EU, US) in terms of electricity scarcity (See Graph 18). For this reason, a weakening credit impulse should make the USD gain, characterizing the anti-cyclical feature of the greenback. Unlike other currencies, EUR/USD has no real policy resistance as both the FED and the ECB can live with a lower EUR/USD.

Finally, by having a look at the CoT in Euro Futures, we can appreciate the weakening popularity of EUR throughout 2021. This week positions have been net short for the first time since March 2020, when the pandemic initiated. (Refer to Graph 19).

Evergrande contagion: Fantasia misses payments too, adding pressure to real estate developers’ industry.
Last year, Chinese authorities decided to introduce a “three red lines” policy, which limited the debt growth of real estate developers depending on their leverage as measured by three financial ratios. This new regulation heavily affected Evergrande, which accounts for 2% of the overall GDP of China. Not only Evergrande’s leverage has expanded rapidly over the past few years, but also its profitability has struggled to keep up with its increasing debt. Moreover, the Chinese holding is also undergoing a liquidity crisis as a result of the shorter maturity of its liabilities relative to its assets, and an inability to raise additional debt to meet interest payments and pay suppliers and contractors. To increase its cash holdings, the company has resorted to selling properties at significant discounts; delaying payment to suppliers, holders of its wealth management products and on some of its other liabilities; and offering discounts on properties to debt holders in exchange for payments. Nevertheless, all these actions seem to be insufficient to avoid the collapse of the “Chinese giant” without receiving government support.
Chinese authorities’ reluctance to directly support Evergrande is spreading a contagion effect to the rest of the Chinese property sector. As a matter of fact, two of the bonds issued by Fantasia Group China Co has been suspended from trading after the company missed $206 million debt payment on Monday. The company responded on Thursday stating that their operations have not been halted and added that they are “actively promoting debt service protection measures”. On graph 20, we can see how the bond yields from Chinese developers have skyrocketed in the last quarter. Citi has recently disclosed a timeline of the upcoming maturities for other industry players, except for Fantasia and Evergrande who have already missed payments. (Refer to images 21, 22, 23, and 24)


At the same time, banks are progressively decreasing their exposure to real estate by increasing lending to other sectors (See graph 25). On a decreasing trend since its peak in mid-2016, the percentage of quarterly new real estate loans is close to a 10-year low, when only 10% of these were channelled into this field. On the other hand, the industrial sector has been increasingly gaining momentum, surpassing the 10% benchmark for the first time in the last decade.

Mainland China’s Stock Exchanges resumed trading activity on Friday after the National Golden Week Holiday. While significantly affected by the Evergrande contagion, equities rebounded after both Caixin Manufacturing and Services PMI were released. From Graph 26, we can appreciate how the activity in China’s services sector returned to expansion in September (53.4 from 46.7). The Caixin China General Services Business Activity Index gives an independent snapshot of operating conditions in the sector. A number above 50 indicates an expansion in activity, while a figure below that points to a contraction. Similarly, the Caixin China General Composite PMI, which covers both manufacturing and services sectors has risen to 51.4 in September from 47.2 the previous month.

Chinese equities positively reacted to the announcement of a virtual summit between Joe Biden and Xi Jinping expected by the end of this year. According to US officials, this meeting is a follow-up on the last call they maintained on September 9th. While the details of the meeting are still undisclosed, the White House referred to the subject as an opportunity to ensure that competition between the two superpowers does not veer into conflict.
Disclaimer: I have done my best to ensure that the information provided on this newsletter is accurate and provide valuable information. Nevertheless, the content is used for illustrative purposes only and does not constitute investment advice.
Before you leave…
I kindly welcome your feedback/suggestions/critics, etc to improve the usefulness of it to you. You can reach me at jramos@u.nus.edu. If you would like to receive the newsletters as they are published please subscribe. I also appreciate if you share it with your friends who are interested in this space. Thank you.
Very informative! Thank you Javier