

#04 Weekly market update (11/10/2021 - 15/10/2021)

Weekly performance:


Key takeaways:
Economic calendar. All eyes on Chinese’s economic calendar. GDP growth rate, industrial production, retail sales, among others, could spike volatility in Asian markets. UK CPI data will add further evidence on inflation. Euro area, Australia, and Japan’s PMI indicators will provide a clearer vision of economic manufacturing trends.
Macroeconomic outlook. September’s US CPI +5.4% YoY, accounting for the largest annual gain since 2008. US Retail Sales beat the consensus. UMichigan Consumer Sentiment Indicator shows second worst month since December 2011. September’s EU Car Sales lowest since 1995. IMF downgraded 2021’s GDP forecast amid supply chain disruptions, increasing inflation, among others. The year-end rally could be a good selling opportunity given a possible rate hike in 2022 and, thus, an increased volatility which would handicap credit, stocks and cryptos. Chile central bank raises interest rates from 1.50% to 2.75%.
Equities. Positive gamma if S&P 500 over $4,420. Blackout period starts easing next week. Stronger-than-average earnings season propel equities. Technical indicators show some divergences.
Fixed Income. High volatility on US 10Y Yields, signalling a possible monetary policy mistake. US 5Y30Y yield curve flattening to May 2020 levels. Weekly inflow lower than usual.
Currencies. USD drops after FOMC Meeting Minutes. Turkish lira at new low after Erdogan sacks bank officials.
Emerging Markets. Some Chinese property developers defaulting on its obligations, yields skyrocketing. PBOC blames Evergrande’s management while defending a healthy property market.
Commodities. Copper futures currently in backwardation, reflecting pressure on supply. WTI Crude Oil keeps its strong momentum, reaches $80 for the first time since 2014.
Probably not transitory.
The September’s US CPI data released last Wednesday turned out to be slightly higher than expected +5.4% YoY (vs. 5.3% expected). Core CPI (excluding food and energy) remains unchanged at 4% YoY while on a monthly basis, it has been 0.1% (0.2% vs 0.1% prev) higher than expected. As we can see on Figure 1, the “Energy Commodities”; “Used Cars and Trucks”; and “Utility Gas Service” are the most significant components.

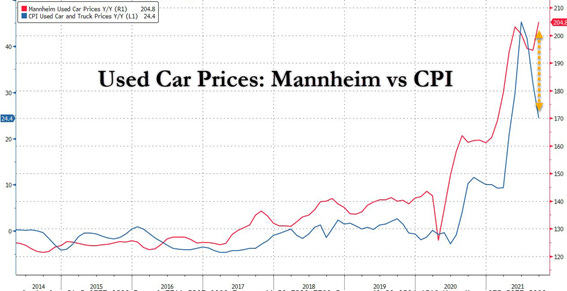
On last week’s market update we saw how the Mannheim Used Vehicle Value Index reached an all-time high accounting for a 200% increase (+43% since early 2020). By adding the evolution of the “Used Cars and Trucks” CPI (See Figure 2), we can easily spot the almost perfect correlation between both indexes. Nevertheless, on September’s CPI data, the Used Cars and Trucks category has not followed the Mannheim index falling 0.7%. Chances are the former will close the gap soon, raising some red flags on the inflation’s transitoriness. When it comes to the “New Cars” category, it has increased 1.3% MoM. Given the bottlenecks on the automotive industry, new cars’ deliveries are being delayed something which will consequently keep on adding pressure on prices.
Declining for a third month in a row, European new car registrations for the month of September marked the lowest level since 1995 (718,598), accounting for a drop of 23.1% YoY (See Figure 3). This decline keeps signalling the limited supply of vehicles caused by the ongoing semiconductor shortage.

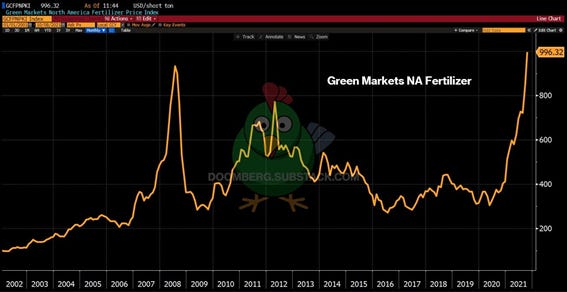
With regards to energy, it has continued to increase 1.3% MoM. Similarly, food has faced a significant increase of 0.9% MoM, mainly affected by higher costs, lack of supply, labour shortages, and broken logistics. On Figure 4 we can see the parabolic increase in the North America Fertilizer Price Index, which is constructed using the fertilizer benchmark prices of US Gulf Coast Urea, US Cornbelt Potash and NOLA Barge DAP. The index is a value weighted based on the annual global demand of each nutrient. Thus, we can see how inflation in the food sector is set to go vertical as a result of the above-mentioned factors.
Households are already “accepting” the increasing trend in prices and there is every likelihood that consumers and businesses will try to regain the lost purchasing power. Were households to push for salary increases, an inevitable price-salary spiral will unfold, bringing about a higher probability of tighter fiscal and monetary policies. Otherwise, real income and purchasing power will translate into a burden on consumption and, as a result, the expansionary phase may throttle back. One of the reasons for the widespread concern about inflation is the velocity at which it is increasing.
According to the monthly World Bank report, US CPI has increased at an annual compounded rate of 3.4% during the last two years (20% and 19% for commodities and energy, respectively), a substantially different rate from the 2% target by the Fed. Said with other words, real purchasing power is being halved every twenty years. Even removing the distortionary food and energy categories, core CPI has been increasing at a 2.9% compounded annual growth rate, the highest increase in the last 25 years.
These inflationary fears are being already reflected on the Consumer Spending and Confidence Indicators. Figure 5 plots the yearly responses of US households, whether 2021 is a good year to buy a house. According to this survey, slightly more than 30% of the respondents consider this year to be a good opportunity to opt for a mortgage. Such a pessimistic scenario had not been seen since the 1980s. While September’s US retail sales surprisingly beated expectations (0.7% vs -0.2% expected), University of Michigan’s Consumer Sentiment indicator has shown the second worst monthly data since December 2011. (Refer to Figure 6). When indexed to the S&P 500, we can appreciate how the weak macroeconomic data is widening the gap between these two, something rarely seen before. (See Figure 7)


Another surprising economic indicator reinforcing the current labour shortage is the number of quits as of August 2021 (Refer to Figure 8). Accounting for 2.9%, quits have reached a new high since December 2000. This indicator is a proxy for the level of confidence among workers who feel they are secure in finding employment elsewhere. This data may suggest that people are less willing to endure inconvenient hours and poor compensation and, consequently, they are quitting instead to find better opportunities. BofA stated that the labour shortage on SMEs and the rising salary pressures are at its highest.

A week characterized by strong volatility in fixed income, divergences in technical indicators, and a better-than-expected earnings season.
Tuesday’s US 10Y Bond auction turned out to be better than expected demonstrating strong demand. After the auction, the 10Y yield dropped 3.5 bps to 1.577%. Similarly, Wednesday’s US 30Y Bond sale was strong and brought about 30Y yields to tumble 6.7 bps to 2.029%. See Figure 9.

After the release of the US CPI data, the 10Y US Treasury continued the rebound on the 1.60% resistance initiated on Tuesday. This decrease in the price of the US 10Y Bonds was one of the main catalysts for the bullish week on the broad market. Nevertheless, a new bounce back after hitting the 1.50% level made the bonds lose half the yield they had gained the previous trading days (See Figure 10).

This increase in the price of bonds initiated a domino effect by propelling utilities and, on the contrary, prejudicing banks, who are the most sensible to bond yields’ fluctuations. This chain ended up negatively affecting the USD while gold activated its negative correlation with the greenback. This surge in the prices of gold fostered by the plunge in the USD and the US 10Y Yields translated into a month-high downplaying the rising expectations of the Fed hawkishness. Yet, this trend could be reversed once the Fed initiated tapering since the opportunity cost of holding gold increases when central banks hike rates and/or decrease stimulus.
It is worth mentioning that yield curves in the US and the UK are significantly flattening, something which indicates both an increasing risk of inappropriate actions/measures by central banks and a more pessimistic perspective for long-term growth. Referring to Figure 11, we can see the US 5Y30Y yield curve, which has flattened to levels last seen in May 2020. According to historical evidence, every time yield curves have significantly flattened has been a strong recession signal. From a macroeconomic point of view, bonds are sending the signal that central banks are trapped in the current monetary policies, and a tightening in this would be considered an irreversible mistake which could threaten market stability. Deutsche Bank surveyed +600 fund managers and observed that “A central bank policy mistake” was the second most common threat. Actually, the rise in interest rates by the ECB in 2011 must be a vivid memory for many fund managers as that action caused a worsening in the debt European crisis and ultimately led to a recession. As a matter of fact, according to BofA, only $77 million have gone to bonds, compared to the average of the last months of ≈$10,000 million.

As we can see on Figure 12, the S&P 500 ended the week closing over the MA50. According to quants, as long as the S&P 500 trades above 4,420, positive gamma prevails. This translates into the market being less responsive to changes in price. This “acceleration” which defines the gamma concept can be appreciated on the violent oscillations throughout the last two trading week, when gamma was negative. Orange ovals highlight some positive gamma trading days while the purple oval shows the recent negative gamma. As observed, price oscillations tend to be lower in the former.

One technical indicator which was anticipating the rebound on the 100MA has been the Dark Pool Index. The red lines in Figure 13 shows the divergence between the S&P 500 and DIX. While the former was plunging, institutional investors were piling up, a signal that a rebound was likely to occur. Similarly, Figure 14 pictures Gamma Exposure (GEX) on September 30th being the lowest in the last 2 years. For a more extensive explanation of the Dark Pool Index functioning, please refer to #02 Weekly market update (27/09/2021 – 01/10/2021) post.


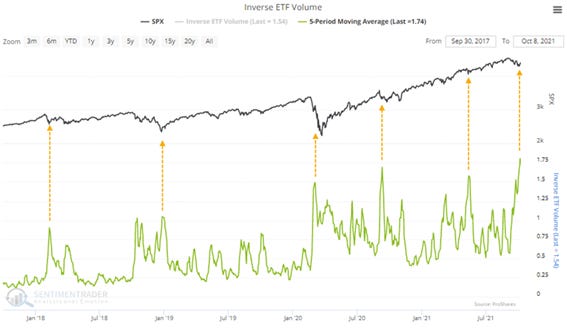
Nevertheless, not all indicators show strong technicals. Figure 15 corresponds to the Major Index Combined Hedger Position indicator, which measures the degree of optimism/pessimism of market makers, banks, and some hedge funds based on their respective positions. The blue line represents the positions of these players and, as we can see from the graph below, whenever the blue line exceeds the green dotted line, the market has initiated a bullish trend. On the contrary, whenever their positions substantially exceed the “Excessive Optimism” benchmark, the market has either remained flat or initiated a significant correction. As of today, we find ourselves in front of another “red dot” scenario. As a result, Sentiment Trader also published the volume of the S&P 500 Inverse ETF. As we can appreciate in Figure 16, the inflows have vastly increased, reaching a new high.

Earnings’ season is out and as of today, overall results are around 10% better than the average historical. Figure 17 shows earnings by sectors compared to the consensus. As shown, all companies in the financials, health care, industrials and real estate sectors have beaten expectations. Similarly, overall results for consumer staples and technology have been positive overall, except for consumer discretionary, which results are currently being worse-than-expected. As we can see in the Sectorials’ table on the weekly performance, all sectors have been bullish, except for energy, with a decrease of 0.19%. This reinforces the crucial role earnings season has played on the equities’ performance, regardless of being at the peak of the blackout period. Earnings season will continue next week with some important names like Netflix, P&G, J&J, Tesla, IBM, AT&T, Blackstone, etc. (Refer to Figure 18)


Something worth mentioning is that Friday was an option expiration day, and according to Goldman Sachs, throughout 2021, the following day is being significantly more volatile than any other trading day (±1% vs ±0.6%). On the second chart, Goldman studies the implied volatility and concludes that chances are the S&P500 average stocks’ implied volatility will be more than double what it was during the 2012-2019 period. (Refer to Figures 19 and 20).


But the macroeconomic outlook has not changed…
In the last weeks, many people have compared the current scenario with the 1970s, when energy prices skyrocketed, and inflation tripled (6.8%) the rate of the previous two decades. The fact that most investment banks have dismissed stagflation arguing that 2021 cannot be compared to the 1970s does not imply that some striking similarities may be drawn between these two periods. The most recent economic data suggest that the bond market will need to cope with higher-than-expected inflation longer than initially anticipated. Moreover, inflation forecasts were raised at Wednesday’s FOMC, suggesting inflation will surpass the 2% benchmark until 2024. While many of the factors driving inflation up signal “transitory” supply-side shocks (e.g. labour and semiconductor shortages, commodity price spikes), the vast majority suggest a persistent rise in inflation. This has brought about central banks to be more concerned about persistent inflation, ending up in a price-salary spiral. Provided the economic recovery remains broadly on track, FOMC members stated that if they decided to start tapering asset purchases at their next meeting, the process could initiate in mid-November or mid-December. Recall that the Fed liquidity additions in 2020 were of $8.5 trillion; $2.1 trillion in 2021; and $0.1 trillion in 2022 (expected).
Given the tapering is almost a reality, the attention has now been shifted to the calendar of the next interest rate hikes. As previously commented, there has been a sharp monthly increase on 10Y yields. The market is currently pricing a 0.4% rate hike in the US; 0.8% rate increases in the UK and Canada. Nevertheless, the market is only pricing a 0.1% rate hike by the end of 2022. (See Figure 21) This divergence in the market pricing of the rate hikes, shows the difference in policies across central banks. While the Fed and the BoE will have already started the tapering, the ECB is expected to be purchasing bonds until at least the end of 2022. As a result, Eurozone bonds (e.g. German Bunds) seem to be providing more attractive risk-adjusted returns compared to US Treasuries.

When it comes to equities, Goldman Sachs recently published a paper in which they study its performance under stagflationary periods. As we can see in Figure 22, stagflation is the worst-case scenario for equities as the average quarterly return for the S&P 500 since 1960 is of -2.1%. Additionally, realized volatility during periods characterized by slow growth and high inflation tends to be the highest.

They also analyse the performance by sectors during stagflationary periods. As we can appreciate from Figure 23, industrials is the most affected sector, followed by technology and materials. On the other side of the spectrum, we can see health care and energy are the most favoured industries. This infographic coincides with the trade idea suggested by BofA consisting of rotating from QE-winners to QE-losers.

Morgan Stanley also published its paper giving their opinion. First, they compared the returns between equities and fixed income. They observed a return below the mean by the former, especially on European and Emerging Markets’ equities. By sectors, they coincide with Goldman Sachs on health care, energy and defensives being the ones who benefit the most under the analysed macroeconomic scenario. Said with other words, a good trading strategy could be shorting the S&P 500 and going long on health care or energy. With regards to fixed income, they observe that US Treasuries tend to yield higher returns on inflationary periods, indicating that markets have been already discounting higher yields by the moment inflation starts decreasing.
Finally, the International Monetary Fund (IMF) downgraded its forecast for 2021 world GDP to 5.9% from 6.0% in its July update while keeping next year’s outlook unchanged at 4.9%. The IMF cited the Delta virus variant, supply chain disruptions, accelerating inflation as risks to economic prospects. (Refer to Figure 24)

Evergrande contagion, improving?
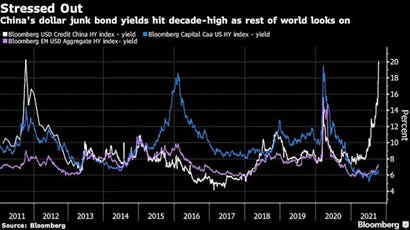
October is being a bumpy ride for Chinese developers as a result of the Evergrande contagion effect. On October 4th, Fantasia defaulted and two of its directors resigned. Xinyuan, another property developer stated that they will only pay 5% of the note due on October 15th.Similarly, Sinic announced they would not pay the principal and interest due on October 18th. Others like Modern Land asked for a 3-month extension. Consequently, yields have been exponentially increasing in the last weeks (Refer to Figure 25)
PBOC broke its silence last Friday and attributed the Evergrande crisis to the poor management. “It had poor management in recent years. It failed to run its businesses cautiously according to changes in market conditions, but expanded blindly. This led to the deterioration of operational and financial indicators and eventually broke into a crisis”. These were the words of Zou Lan, the head of the finance department at the PBOC. During the meeting they also downplayed the contagion effect on its financial system by praising the Chinese property sector healthiness. Financial authorities are currently cooperating with urban planning agencies and local governments to provide financial support to restart constructions as soon as possible.
Fears of a housing bubble are emerging, and Beijing decided to take the first step by implementing property curbs in an attempt to cool the country’s real estate market. Other cities like Harbin announced a 100,000 yuan home-purchase subsidy to “talents” that meet certain requirements.
Turkish lira at new lows.
Turkey’s President Erdogan appointed two new members in place of Semih Tumen, Ugur Namik Kucuk and Abdullah Yavas, who all opposed to proposed rate cuts. As a result, the USD/TRY reached a new low of 9.1900 (-1%; -19% YTD) (See Figure 26). Last month, while inflation accounting for 20%, the central bank had already cut rates from 19% to 18%, an action which led to a selloff in the lira. The bank’s next policy-setting meeting is expected to take place on October 21st.

Commodity prices reflect supply-shocks.
Copper has reached a new high since the beginning of August. While the price of copper may be a sign of economic recovery, the current price levels do reflect the supply shock which is currently spreading from China to Europe as energy shortages drive up costs for electricity and natural gas, reinforcing the inflationary pressure from rising commodity prices. In Figure 27, we can see how copper futures are now in backwardation, signalling broad pressure on spot supply.

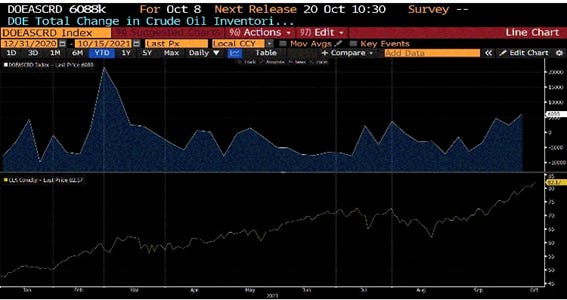
With regards to WTI Crude Oil, fears of tightening supply have driven oil prices up. Nevertheless, as showed in Figure 28, US Inventories have been steadily increasing over the last three years, showing an unusual divergence. Similarly, this strong demand for oil is also reflected in the options market, where Brent Oil calls significantly outnumber puts (Refer to Figure 29).

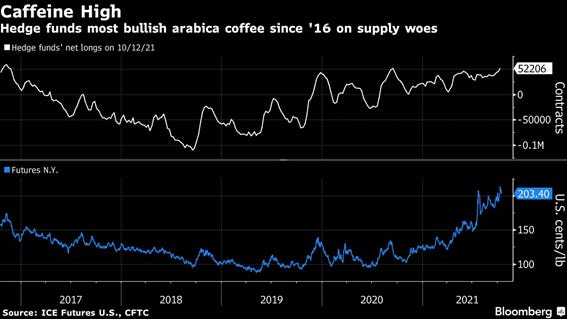
Arabica coffee futures reached a 7-year high as a result of a lower-than-expected crop output. Brazil, the biggest exporter of Arabica Coffee, has harvested around 40% less coffee than last year, and the least amount since 2009 (30.7 million bags vs. 48.8 million last year). Said with other words, this lost in harvest could have satisfied the consumption needs of two thirds of the US consumption, the largest coffee consuming country. As a result of this shortage, prices are steadily increasing. As we can see in Figure 30, Hedge funds’ net longs on Arabica Coffee are increasing, being the most bullish since 2016.
Overall, the commodities’ strong momentum has led commodity-linked currencies such as the NZD (+1.86%), CAD (+0.92%) and AUD (+1.60%) led gains against the USD, boosted by a strong revival in risk appetite and higher oil prices.
Disclaimer: I have done my best to ensure that the information provided on this newsletter is accurate and provide valuable information. Nevertheless, the content is used for illustrative purposes only and does not constitute investment advice.
Before you leave…
I kindly welcome your feedback/suggestions/critics, etc to improve the usefulness of it to you. You can reach me at jramos@u.nus.edu. If you would like to receive the newsletters as they are published please subscribe. I also appreciate if you share it with your friends who are interested in this space. Thank you.