#05 Weekly market update (18/10/2021 - 22/10/2021)

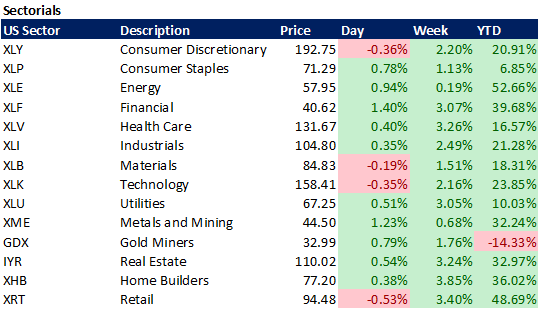
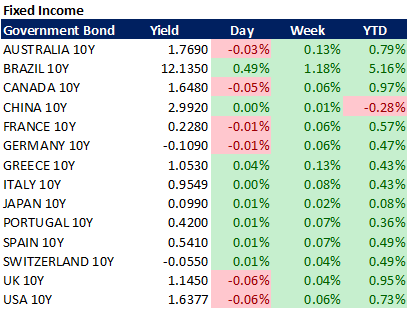
Weekly performance:


Key takeaways:
Economic calendar. With the recent lost confidence in the transitory inflation narrative, the spotlight is on next week’s ECB, BoJ, and Bank of Canada meetings. Australia’s PPI, Retail sales, and Germany’s GDP will add further relevant macroeconomic insights.
Macroeconomic outlook. Germany reports highest PPI YoY since October 1974. Jerome Powell expects inflationary pressures to last more than expected. Atlanta Fed’s 2021 Q3 GDP growth forecast near contraction. 5-Year Breakeven Inflation rate at 2.77%, levels not seen since April 2005.
Equities. 46% of the S&P 500 companies expected to report earnings next week, FAANGs (except for $AMZN) included, leaving the door open to an increase in volatility. Retail investors and CTAs propel SPX over the MA50. Buyback window progressively reopening. Favourable seasonality ahead for SPX, initiating on October 30th .
Fixed Income. Bond allocation at a record low. US 10Y treasury yielding 1.6377%. US2Y-10Y yield curve steepening.
FX. BRL/USD, the worst EM performer, sets a new six-month low. Betting on the Indian Rupee or Korean Won to provide the best risk-adjusted return depending on the inflation performance. The USD has underperformed most of the major currencies during the week.
Emerging Markets. Chinese economic data sending “cooling down” signals after missing consensus. Evergrande avoids default after paying a $83.5 million bond coupon before its weekend’s deadline. The contagion effect persists across its peers. BOVESPA plummets after four senior Brazilian Treasury officials resigned amid government aiming at lifting constitutional spending cap.
Commodities. Copper spot contracts soar to $1,000, highest in the last 27 years. Crude Oil WTI futures keep increasing, setting a new high since October 2014.
China: Recovery’s losing steam
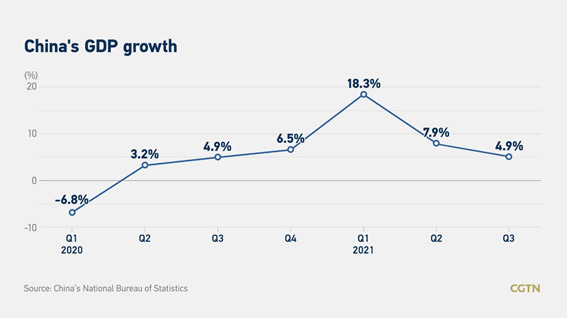
The week started with the release of the Chinese economic data on Monday. With regards to GDP Growth, China has grown 4.9% QoQ (vs. 5.2% consensus), exactly at the same rate that on Q3 2020, when the second largest world economy was still recovering from the pandemic (Refer to Figure 1). Despite CPC having set the target of GDP growing by more than 6% during 2021, the third-quarter data showed further signs of rising stagflation. Nevertheless, as we can appreciate in Figure 2, the unemployment rate has declined from by 0.2% (4.9% vs. 5.1% prev.), something which may suggest the government’s reluctance to launch stimulus and boost growth. As a matter of fact, at their last press conference, the PBOC implied the monetary policy would not change significantly.

Retail sales have increased by 16.4% YoY, slightly better than last month despite being affected by the movement restrictions imposed after the surge in Delta variant cases. It is worth mentioning that the real estate crisis is taking its toll on consumer confidence as 70% of household wealth is linked to real estate, something which has altered spending patterns. As for industrial production, it has grown 11.8% YoY.
Ultimately, as we can see in Figure 3, both show a negative trend. While many attribute the Chinese slowdown to rising energy prices, debt mismanagement, political shifts towards the functioning of markets or the pandemic itself, I believe China has a structural problem with regards to investments. Since the last two decades, China has no longer been underinvested (benchmarking to its ability to properly absorb investments). Hence, what we have witnessed during the last years is the degeneration into what Xi Jinping once described as “fictional” growth. In order to fix this unsustainable trend, China needs to revert this investment-driven model, something which Albert O. Hirschman, already studied on "Industrialization and its manifold discontents: West, East and South (1992). According to Hirschman, implementing such a transformation is one of the most challenging tasks for a country. For this reason, unless a radical political and systemic transformation takes place, slower growth is inevitable for China.

BofA: Fund managers’ survey
BofA has recently published its monthly survey to 430 fund managers, with combined $1.3 trillion in AUM. Despite the results represent a mere opinion, some interesting facts may be observed.
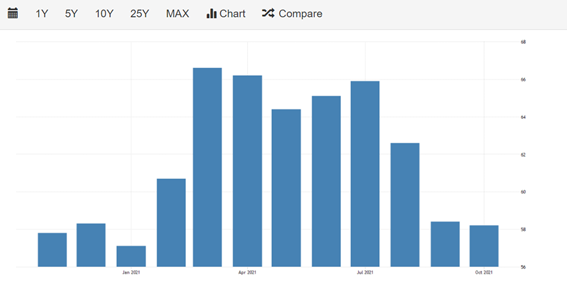
First, the levels of cash have reached its highest in the last twelve months. As we can observe in Figure 4, throughout 2021 fund managers have been piling up cash as the S&P 500 increased. Another divergence can be observed in the FMS Macro Indicator (Refer to Figure 5), which compares the % of asset allocators who are currently overweighting equities (dark blue line) to the net % of investors who predict a stronger economy (light blue line). While both variables tend to go hand in hand, they are currently presenting the widest gap since the 2008, when the indicator was created.


BofA also collects data on the biggest tail risks for the present month by these asset managers. As observed in Figure 6, the biggest perceived threat is inflation with a 20% increase MoM followed by China, which was inexistent during September. Similarly, the Fed tapering decision is a new perceived tail risk this month. Conversely, Covid is being progressively dismissed by fund managers, accounting for a decrease of 15% MoM.

Fund managers were also surveyed about the implications of the Fed taper expected to be announced in November (See Figure 7). According to them, the three most likely outcomes will be an increase in volatility (25%), a stronger dollar (22%), and higher credit spreads (19%).

Bank of America takes the fund managers’ reported positions to compute a comparison in their portfolios with the average position of the past 10 years (See Figure 8). As expected, commodities, banks and REITs are the most overweighted sectors. On the other side of the spectrum, we can find Bonds, EM and Utilities as the least preferred picks. The fact that bonds’ underweighting being at historical minimum levels comes as no surprise given more than 70% of the surveyed managers claim to be net short in bonds (Refer to Figure 9).


Strike while the iron is hot: Macroeconomic outlook worsens, so do bonds reflect. Equities take advantage of their strong momentum.
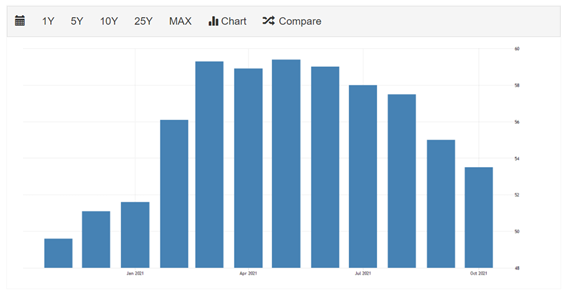
Manufacturing and Services PMI for the Euro area, Germany and France were published on Friday. All of them showed a slowdown in business activity during the month of October. Figures 10, 11 and 12 show the manufacturing PMIs while Figures 13, 14, 15 depict services PMI. Let’s analyse the manufacturing PMIs first. Retreating to 53.5, France’s PMI missed expectations of 54 and kept on decreasing for eight months in a row. Similarly, Germany reached a nine-month low of 58.2 (Sep: 58.4). Despite beating expectations, the Euro area PMI also followed the same trend edging down to 58.8, reaching an eight-month low. Phil Smith, an analyst from HIS Markit stated that if the current employment trend is prolonged, the bargaining power of employees could bring about a forced rise in salaries, something which could add further pressure on the cost structure of businesses.
The Services PMI kept showing a decreasing trend MoM except for France, which brought its five-month low to an end with 56.6 (prev. 56.2). Actually, that expansion was one of the quickest over the last three-and-a-half years. Germany and the Euro Area, dropped to 52.4 and 54.7, respectively. These significant decreases in the indicators were not seen since early 2021, signalling persisting concerns regarding Covid-19.


Throughout this week, we have seen liquidity, bitcoin, equities and quits rate at record highs. Conversely, as BofA observed in their frequent FMS, bond allocation is currently at record lows for institutional investors (≈80%), for their private clients (≈17%) and for US households (≈19%). (Refer to Figure 16). The current inflationary pressures keep on increasing as the market progressively loses confidence in the transitory inflation narrative. As a matter of fact, the 5-Year breakeven inflation rate soared to 2.77%, the highest since April 2005 (See Figure 17). Similarly, as we can appreciate in Figure 18, the yield curve has kept on steepening (1.18 as of October 22nd) , as the 2Y US Treasury has increased 6.25 bps (0.457%) while the 10Y US Treasury has soared 5.25bps (1.636%).


The divergence between equities and the macroeconomic outlook has widened during the last week as equity indexes, especially, the S&P 500 and NASDAQ have closed the week with +1.82% and +1.69%, respectively. The outperformance has been driven by a combination of technical and seasonal components. In Figure 19, we can see the evolution of the S&P 500 e-mini future. As observed, the index initiated a big rebound moving from the 100MA to the 50MA in a single trading day. As a matter of fact, five trading days were more than enough to recover the losses of the last four weeks.

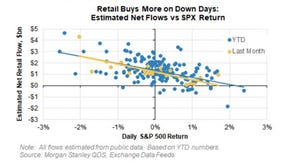
Michael Wilson from Morgan Stanley quickly identified that retail investors had jumped on the bandwagon again through call options, propelling the index up. Actually, there is a strong correlation between the amount bought and the SPX return, suggesting that the more the S&P 500 decreases, the higher the retail inflow. (See Figure 20).
Also, the quantitative analyst Charlie McElligott from Nomura identified that the (long) exposure of CTAs to equities had increased to 75% (122,700 million) during that trading week. This implies that they shifted from being short to long at 75% of their capacity, still having room for a higher exposure (Refer to Figure 21). It is worth mentioning that CTAs just rely on technical indicators rather than on macro.

Another factor which has contributed to the sustenance of the latest bullish trend has been the Market-on-Close (MoC) orders. These types of orders, which are mainly used by ETFs and mutual funds to carry out changes to portfolios, are executed at or after the closing of a stock exchange. Figure 22 depicts the evolution of the last trading week’s MoC. Four out of the five trading days have witnessed “Buy” imbalances, indicating that institutional investors were substantially consolidating their positions.

Earnings are also playing a crucial role in the evolution of the major American Indexes. Figure 23 indicates whether the earnings for S&P 500 companies’ have outperformed the consensus. According to FactSet, this is the third best earnings campaign since that metric was first computed (2008), with 84% of the index components beating consensus (historical average = 64%). Nevertheless, that 16% who have underperformed have been punished the following day after publishing. As we can see in Figure 24, the stocks reporting lower-than-expected EPS have underperformed the SPX by more than -4% on average, something that had not occurred since 2017. Some good examples of this negative reactivity have been $SNAP or $INTC, which have plummeted 21% and 10%, respectively.


Except for Amazon, all other FAANG stocks are expected to report their earnings next week, something which could further boost the fluctuations of the S&P 500 given their weight (≈25%). As a matter of fact, companies expected to report earnings by next week currently account for 46% of the S&P 500. Following this logic, a substantial percentage of companies will have already ended their blackout period three days after the reporting date. According to Goldman Sachs, 65% of the companies will enter into the new buyback window by November 1st. (See Figure 25)

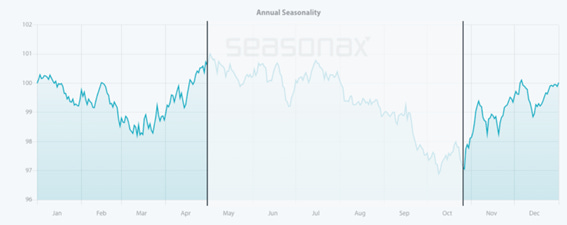
Finally, seasonality is also a tail wind for the SPX. Seasonax, one of the leading specialists covering seasonal patterns in the stock market, has recently published the favourable seasonality ahead for SPX. Figure 26 demonstrates the strong outperformance of the S&P 500 between October 26th and April 30th. They also analyse the hypothetical return of an investor who had held its position in the SPX since 1996 (See Figure 27). As observed, this investor would have only suffered losses in 4 occasions. Notice that since 2008, this strategy has worked according to plan every single year except for 2019. Seasonax attributes this favourable seasonality to the increase in spending on Halloween and Black Friday. Moreover, the year is brought to an end with the Christmas shopping combined with the optimism bias which characterizes December.

Inflation: More persistent than transitory
As previously observed on the BofA survey, inflation is currently the biggest “tail risk” for asset managers. Nevertheless, this seems not to exclusively apply to them. Rather, inflation is taking its toll on main street. As a result, businesses’ supply chains (lots of them have even been forced to shut down), wages, and ultimately, consumers’ behaviours are some of the countless impacts of a rising inflation. On top of that, the last months’ poor macroeconomic forecasts have spread stagflation fears. In Figure 28 we can appreciate the evolution of the word “stagflation” on Google searches.

The Federal Reserve Bank of Atlanta published its 2021 Q3 GDP forecast last Tuesday. According to their mathematical model based on a combination of economic indicators, real GDP will grow at an annualized rate of just 0.5% in Q3. As we can see in Figure 29, that same model returned a growth of over 6% by August 2021. Seven weeks later, GDPNow is near contraction, showing the vertiginous velocity at which the economy is changing.

Last Friday the Fed Chairman Jerome Powell spoke to the Virtual Bank for International Settlements’ South African Reserve Bank Centenary Conference, who surprised the market with a change in his narrative about the inflationary outlook. The Chairman stated that data is suggesting longer and more persistent bottlenecks, and thus, higher inflation. What he used to label as “largely transitory” on last August’s Jackson Hole Meeting has now shifted to “lasting more than expected”. He also stated that the start of tapering won’t likely disrupt the recovery in the labour market and affirmed markets are prepared for it as he expects the US to reach maximum employment by next year. With regards to the interest rate hikes, he dismissed such an action in the near future. Soon after the meeting, VIX reached a four-day high of 16.39. It is worth mentioning that the spread between the VIX’s spot and futures has progressively increased, something which indicates doubts about the performance of equities in the next four months.
As discussed some weeks ago, energy prices have been the main drivers of the increasing inflation: First coal, then gas, and now oil. As of today, China is the world’s largest coal consumer and, as a matter of fact, 60% of its electricity is generated by coal combustion. Nevertheless, not only the reduction in fossil fuel dependence is considered to be one of the key targets for the next years, but also 2022 Winter Olympics are just around the corner. For this reason, the Chinese government has recently announced tougher punishments for regions who fail to meet CO2 emission targets and, consequently, China’s electricity generation has been dramatically disrupted. It comes as no surprise that the PPI for the month of September had already reflected both significant coal production shortage and a 75% increase in its prices.
Immediately, the coal shortage drove Chinese price indexes to similar levels to those of Europe, where the energy crisis is affecting the most. As we can observe in Figure 30, the situation in the US is more contained than in China and the EU. Nevertheless, the severity of the impact differs across regions.

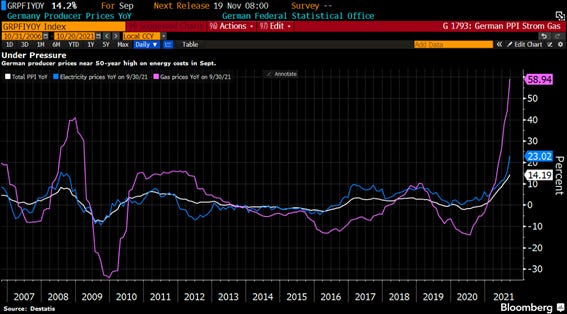
This week, Germany has reported an increase in PPI of 14.2% YoY, the highest annual rate since October 1974. Figure 31 shows PPI compared to gas and electricity prices. Excluding energy prices, PPI would account for +8.6% YoY, signalling that the inflationary pressures are not exclusively dependent on rising energy prices. If we compare the PPI-CPI performance between Germany and China, we can see how the gap between both indicators is bigger for the latter. As observed in Figures 32 and 33, inflation is not being increased in China, which suggests that in Germany the increase in prices is being passed on to consumers. Yet, this has not occurred in China as the producers seem to be absorbing the higher costs. Figure 34 may provide another answer to the divergence. On that graph we can see the evolution of prices of US imported goods manufactured in China. Clearly, prices have significantly increased throughout 2021, which may indicate that China may have decided to pass the increase in prices through exports.


If there is something clear is that this divergence is undoubtedly related to the CPC’s “Common Prosperity” ideology. Being one of its key policy objectives, the CPC stated that the private sector should work for the people instead of being driven by profits, something which could encourage producers to absorb increasing prices. Ultimately, it has been this “Common Prosperity” priority what has caused the government to intervene into technology, education, gaming, entertainment, and real estate sectors.
Given the energy crisis repercussions are global, Nordea has recently published a playbook deducing the winners and losers. First, they have ranked countries by energy consumption over GDP (See Figure 35). Then, they divide countries between net importers and net exports of energy and measure its balance relative to GDP (Refer to Figure 36). According to this indicator, South Korea, Thailand, and India are the three most prejudiced countries given their reliance on external sources of energy. On the other side of the spectrum, we can see how Russia, Norway, and Colombia as the three big winners. As observed, the EU has a greater dependence on imported energy than the US. It is worth mentioning that a country being considered a “winner” does not necessarily imply that its currency will be labelled as such. Figure 37 depicts the performance of the currencies of the analysed countries YTD against that since the energy crunch started in September. Thus, going long on the Indian Rupee could be a good risk-adjusted trade for those who believe energy prices remain elevated. Conversely, these seeing a drop in energy prices could opt for going long on the Korean Won.


The shipping crisis is taking its toll in Los Angeles, where a new all-time high of 103 container ships were stuck at the terminals. Moreover, empty containers are currently flooding Anaheim Street, reflecting the huge impact of the backlogs originated. Similarly, China is also suffering from a slowdown in the number of containership exits, which exceeds -20% as of today (Refer to Figure 38). As a result, it comes as no surprise that the World Container Index (See Figure 39) accounts for almost $10,000, which is the current amount required to ship a 40ft container. To put it into perspective, shipping the same container on that same week of 2020 would have cost 281% less. The change in price would be even larger for the Shanghai – Rotterdam route, with an increase of 558% with respect to 2020 (Refer to Figure 40).


Consequently, these disruptions in the price of energy as well as in the freight rates have been reflected in the CRB RIND index (See Figure 41), suggesting that manufacturers are currently forced to deal with higher costs.

Evergrande saves first match ball. The game is not over yet.
The Evergrande drama and its contagion across the Chinese developer peers has been one of the highlights of the week. Throughout the week, On Wednesday S&P considered Sinic to be under technical default. That same day, Kaisa Group experienced a drop in its bond prices after cancelling its investor meeting. The imbalance of Evergrande’s assets against its liabilities accounting for RMB 2 billion has led the most indebted property developer to lose 80% of its market cap YTD. Some experts claim that the chances of the developer surviving rely on its ability to quickly dispose of its assets. Actually, the company reported on Wednesday its contracted property sales totalling RMB 442.3 billion, -90% YoY. Also, its plans of selling its Hong Kong office have been dismantled.
On Friday, Evergrande avoided default (at least by now) after complying with its $83.5 million bond coupon payment to its bond trustee (Citibank) on the 30th and last day of its grace period. As a result, shares rebounded 7.8% (Refer to Figure 42) and China High Yield has dropped below 18% (See Figure 43). Yet, Evergrande’s precarious position has not changed, and the next acid test will take place next week, when a $47.5 million interest payment is expected to finalize its grace period. On top of its obligations of thousands of millions in local bonds and banking loans, the company has still to comply with its creditors given it has already missed coupon payments equivalent to $195 million. The uncertainty will remain at least until 2022, when $6,100 million in international bond payments are expected to expire ($340 million due in 2021).


Hayden Briscoe, head of FI at UBS APAC stated that Evergrande assets are still more valuable than what its bond prices currently reflect. What is certain is that, as of today, Evergrande Real Estate currently owns more than 1,300 projects in more than 280 cities across China, and around 12 million homeowners live in their properties. Managing 7.3 billion square feet of land (plus 1.4 billion currently under development), Evergrande has more land under management than the entire area of Manhattan (6.4 billion square feet). Ultimately, time will tell whether Evergrande is too big to fail.
BOVESPA drops 7.28% after tumultuous week at Treasury
The Brazilian stock exchange has been the worst performer among all major world indexes. Four Treasury officials resigned after the government announced plans to increase spending on the eve of next year’s election. With this popularity on freefall and some of the Senate members calling for criminal charges over his handling of the pandemic, Brazilian president Jair Bolsonaro contemplates an extra 84 billion reais ($14.7 billion) in spending for next year. He has also committed himself to more than double the amount of its cash-transfer programme to BRL 400. Said with other words, more than 17 million Brazilian families will receive between next month and December 2022, at least BRL 400 ($70) per month. In order to cope with the increasing price of oil, Bolsonaro has promised a single payment of BRL 400 to 750,000 truck drivers. As a result, both the stock exchange (See Figure 44) and the Brazilian real plummeted (Refer to Figure 45).


Consequently, the BRL has not only surpassed its six-month low but also been the worst performer EM currency this week with a loss of 4.5% to the USD. As a result, were the rising fiscal risks materialize, the Central Bank of Brazil would be forced to tighten policy more aggressively in order to manage increasing inflation expectations. Ultimately, this would add further pressure on 2022 GDP growth. Some economists from Credit Suisse and UBS now predict an increase of 125 and 150 bps, respectively, something which the Brazilian 10Y yield has discounted. (See Figure 46)

Disclaimer: I have done my best to ensure that the information provided on this newsletter is accurate and provide valuable information. Nevertheless, the content is used for illustrative purposes only and does not constitute investment advice.
Before you leave…
I kindly welcome your feedback/suggestions/critics, etc to improve the usefulness of it to you. You can reach me at jramos@u.nus.edu. If you would like to receive the newsletters as they are published please subscribe. I also appreciate if you share it with your friends who are interested in this space. Thank you.