

#06 Weekly market update (25/10/2021 - 29/10/2021)

Weekly performance:


Key takeaways:
Economic calendar. China and US’ PPIs expected to be released next Tuesday. Similarly, CPIs for the two biggest economies and Germany will be published on Wednesday. UK will report its GDP growth next Thursday. That same day, the OPEC is expected to release its monthly report.
Macroeconomic outlook. Spanish CPI soars to 5.5% YoY, worst since 1992. US GDP growing at the slowest pace since 2Q 2020. Blackstone CEO, Stephen Schwarzman, states the global energy crisis is severe enough that it could fuel social unrest and worsen the actual inflationary pressure. Baltic freight shipping costs down 28% from peak. The Bank of Canada announces rates could be hiked sooner than expected.
Equities. VIX/VXV close to 0.8, strengthening the likelihood of a Christmas rally; 4Q’s buyback window progressively opening; Amazon and Apple report worse-than-expected-earnings. New all-time high for S&P 500 at $4,560 after rebounding from $4,279 in October 4th.
Fixed Income. US 2Y yields had its worst month in the last three years. 3-month EURIBOR futures plummet discounting a rate hike by end of 2022. 1-day move in US 2Y Yield exceeds 5-sigma. US 30Y-20Y yield curve inverts for the first time.
FX. Bearish week for the EUR as investors remain sceptical on the ECB’s inflation narrative and commitment to low interest rates.
Emerging Markets. Chinese Equities underperform MSCI World for a ninth month in a row, worst bearish trend since 1993. Evergrande avoids default after paying offshore bond interest payment.
Commodities. San Francisco gasoline prices reach new all-time high at $4.75 per gallon. European Natural Gas dropped 3.86% on Friday after Putin’s order to fill EU storages.
Stagflation: Low growth & high inflation.
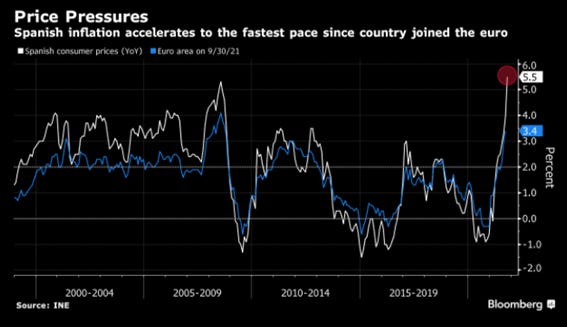
Spanish macroeconomic data has raised red flags on inflation. Outnumbering that of the Euro area by almost 2%, the Spanish CPI has soared to 5.5% YoY (vs. 4.5% expected). As we can see in Figure 1, Spain had not experienced such a high inflation since 1992, long before joining the Euro. Moreover, this rising inflation could prove a real challenge for pension schemes as they are linked to the CPI. As a matter of fact, 6 out of every 10 Euros in social expenditures correspond to pension schemes. Nevertheless, Core CPI remains close to the 1% YoY, demonstrating the huge inflationary pressure on food and especially, energy. (See Figure 2).

The Spanish PPI soared 23.6% YoY (18% prev.), casting doubts on the “transitory inflation” thesis (See Figure 3). As analysed last week on #05 Weekly market update (18/10/2021 – 22/10/2021), the correlation between CPI and PPI in Germany was extremely high compared to China, where abnormal PPI figures are not being reflected in CPI as a result of both the “Common Prosperity” approach and inflation being “exported”. Thus, the generalized increase in PPIs has two possible outcomes: Either producers absorb the higher manufacturing costs, something which would then take its toll on their future earnings, or, on the other hand, producers opt for passing these costs to consumers, which would then negatively affect to CPI and ultimately, trigger a domino effect.
None of the options are positive economically speaking, but were costs to be passed to consumers, families would have to cope with an increase in prices, something which would be translated into less consumer spending. At the same time, industrial production (already affected by high PPI) would severely drop given the decrease in consumption. If costs were absorbed by businesses, a significant number of companies would go bust because of its incapability of dealing with another external shock, one of the countless they have gone through since COVID initiated. Recall that companies are paying in freights triple the amount they were paying some weeks ago (x20 the amount paid in October 2020). As a result, governments should tread labour and taxation legislations carefully in order to minimize the impact on the industrial fabric. Overall, whatever option takes place, a decrease in GDP growth seems inevitable.

The official US GDP growth was published on Friday, turning out well below market forecasts of 2.7%. The US economy has grown at an annualized 2% in Q3 2021, the slowest since 2Q 2020. Yet, Fed Atlanta GDP had already published a new forecast for Q3 of 0.2% (prev. 0.6%) two days before the release of the official data. Being on the verge of contraction, the US economy could enter recession before the FED started tapering (Refer to Figure 4). The velocity at which GDP growth is falling is panicking the market. That same indicator was reflecting 14% as of May 2021, 6% three months ago, and less than 0.5% now. According to Sam Bullard, senior economist at Wells Fargo, the pace of the GDP growth is likely to have decelerated substantially in Q3 as a result of the Delta-variant wave exacerbating labour and material shortages, transportation bottlenecks, and accelerated price gains. According to him, consumer spending is the sector which is expected to drive most of the slowdown as supply shortages and rising COVID infection rates lead to decline in goods spending and a moderation in services spending. The It is worth mentioning that the GDP Now indicator is a running estimate of real GDP growth based on available economic data for the current measured quarter. There are no subjective adjustments made to the indicator, which means that the estimate is based solely on the mathematical results of the model.

This is not the only institution holding a negative outlook for the next months. Last Friday, Russia’s Central Bank hiked interest rates (0.75%) to 7.5%, given inflation currently developing substantially above forecasts (7.5% vs. target of 4%). Less than one week later, Alexei Zabotkin, the deputy governor of the Russian Central Bank, urged to tighten the monetary policy to cope with the rising inflation.
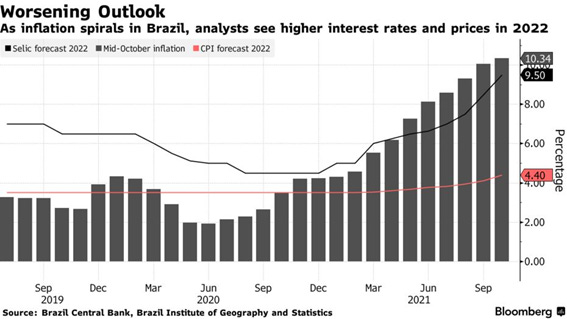
Similarly, the central bank of Brazil also hiked interest rates by 150 bps to 7.75% on Wednesday as a response of Bolsonaro’s proposal of increasing public expenditures (See Figure 5). Brazil has witnessed the biggest hike in the last two decades (575 bps YTD). According to official data, Brazilian inflation surged to 10.34%, while target inflation for 2021 accounted for 3.75%. To put it into perspective, inflation expectations are currently running above the target through 2024. Progressively, central banks are starting to withdraw the stimuli deployed during the pandemic. Figure 6 reflects the different measures taken by central banks in terms of policy rates.

Nevertheless, this map may soon see Canada in pink as the Bank of Canada not only announced on Wednesday its decision to end the quantitative easing but also a sooner-than-expected rate hike. The BoC confirmed they would start decreasing its bond purchases by CAD 2 billion per week from November 1st onwards. As of now, October 27th, the BoC owned CAD $430 billion in bonds.
BoC governor, Tiff Macklem, also gave some further rate hike guidance. He stated that the BoC will hold at the lower bound until slack is absorbed in order to sustainably achieve the 2% inflation target, something which would take place between April and September, a time frame in which the BoC would start considering raising interest rates. Figure 7 depicts the Bank of Canada’s forecast revisions for GDP growth and CPI inflation.

As soon as the meeting concluded, the USD depreciated 0.90% to the CAD. Similarly, the Canadian 2Y bond yield soared 25 bps while the 30Y bond yield fell 35 bps. This implies markets are already pricing most of a first-rate hike by the January 2022 meeting and about 1.5% points of rate hikes by the end of 2022.
Christmas rally and 4Q’s buyback window opening keep propelling equities
Last week we analysed the favourable seasonality ahead for S&P 500. Running from October 30th to April 26th, only 4 out of the last 24 years have yielded negative returns when committing to this strategy. Even Charlie McElligott, cross-asset macro strategy MD at Nomura, agreed on the Christmas rally being one of the leading bullish catalyst for the S&P 500 in the next three months. Consequently, he expects global equities to significantly outperform its historical median over the next month. Moreover, SpotGamma identified an unusual divergence between VIX and VXV. While both indexes measure implied volatility of the S&P 500 options, their time horizons differ. The former measures implied volatility of the S&P 500 options with 30 days to expiration. The latter measures implied volatility of the S&P 500 options with 93 days (3 months) to expiration. As we can appreciate in Figure 8, the 3-months implied volatility is higher than the volatility for the next 30 days, suggesting that institutional investors do believe there will be a Christmas rally, and hence, lower volatility at least until end-of-year. This indicator has remained below 0.8 in nine occasions. In eight of these, the S&P 500 undergone a correction. Nevertheless, this correction has not always been immediate, something which coincides with the Christmas rally hypothesis as these institutional investors acknowledge the poor macroeconomic outlook, and they are covering its positions with derivatives, options and futures among others in the long-term.

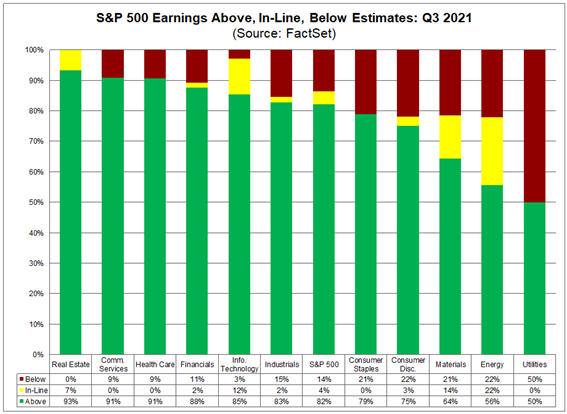
As we approach the end of the 3Q earnings season, the buyback window for the next quarter is progressively opening (See Figure 9). This increase in expected share repurchases will be another major bullish catalyst for the end-of-year S&P 500 performance. As observed in Figure 10, the earnings season for the third quarter of 2021 is still outperforming the historical average by almost 20%. The worst sector during this last quarter is being Utilities, with only half of the reporting companies beating consensus. On the other side of the spectrum, we can find Real Estate, being the only sector with no companies reporting earnings below estimates. According to revenues, Q3 has also been the best quarter as of today, with 75% of the companies in the S&P 500 beating the consensus (vs. 67% historical average). Under this metric, real estate is still the best sector with almost 9 out of 10 companies reporting higher-than-expected revenues. Conversely, that ratio is slightly higher than 50% in Communication Services, the worst performing sector.

This week has also been crucial given that the largest five US companies – Apple (APPL), Microsoft (MSFT), Amazon (AMZN), Alphabet (GOOG) and Meta (MVRS) have reported earnings. Together with Tesla (TSLA), their combined share is 45.6% and 24.1% of the NASDAQ and S&P 500, respectively (See Figure 11). While the overall earnings season is being better-than-expected, Apple and Amazon have reflected serious problems regarding the supply chain bottlenecks and the increasing pressure on wages.

Apple reported higher-than-expected revenues from both iPads & Macs. Moreover, the Californian company highlighted an astonishing increase of 83% YoY in China sales. Yet, Tim Cook stated that the supply chain bottlenecks had costed Apple $6,000 million in sales during the last fiscal quarter. He also emphasized the worst is not over yet, as he expects this disruption to worsen in the next quarter, given the semiconductors’ shortage is currently affecting the manufacturing process in all their products.
Similarly, Amazon not only experienced supply chain bottlenecks, but also expressed its concern in labour shortages. After a successful fiscal year boosted by the accelerated digitalization during COVID, the Seattle-based company is currently having difficulties in contracting employees for its warehouses in the US. In order to attract workers, Amazon has been obliged to increase its average salary to $18/hour and offer higher bonuses.
Figure 12 illustrates the increasing divergence between US household net worth as a percentage of disposable personal income and the US labor force participation rate. Despite in a decreasing trend since the beginning of the XXIst century, COVID led to a sharp decrease in employment. At the same time, the stimulus packages deployed by the American government have brought about a parabolic increase in the US households’ net worth as a percentage of disposable personal income. Consequently, this increase in disposable income has discouraged citizens to re-join the labour force and even some of them have retired earlier than expected.

The only way to attract these people to the labour market is through higher salaries, something which Nordea had already predicted. According to the Danish bank, the persistent increase in inflation will transition to a wage-price spiral. One of the speakers in this week’s “The Future Investment Initiative Institute” has been the Blackstone CEO, Stephen Schwarzman, who stated that the global energy crisis is severe enough that it could fuel social unrest and worsen the actual inflationary pressure. One of the places where this pressure is affecting the most is in Germany, where automakers and machine builders are sending their workers to Kurzarbeit again. Under Kurzarbeit, employees are paid around 80% of their salary while working substantially less. The response has been an increased demand of higher wages (Refer to Figure 13). Another research conducted by Gartner highlights the biggest contributors to inflation according to CFOs. As illustrated in Figure 14, the increase in wages, raw materials and freight rates are the most popular responses. Nevertheless, this wage inflation is not sufficient to catch up with the increasing “Purchase Only House Price Index” which significantly outnumbers the average hourly earnings of production and nonsupervisory employees (See Figure 15).


Lagarde affirms inflation will progressively decrease by next year… and bonds react by pricing an inappropriate monetary policy approach.
ECB President Christine Lagarde spoke on Thursday’s ECB Press Conference and stated that price pressures will last longer than initially expected, mainly affected by supply chain disruptions and skyrocketing energy prices. Nevertheless, Lagarde expects inflation to remain below target in the mid-term. Further announcements on the stimulus are expected in the December meeting. With regards to the monetary policy decision, the ECB decided not to hike interest rates, and said that rates would stay at current or lower levels until inflation accounts for 2% well before the end of projection horizon. As of today, the ECB’s Pandemic Emergency Purchase Programme (PEPP) equals 1.85€ trillion while its Asset Purchase Program (APP) will remain at 20€ billion per month. Something to bear in mind is that the end date of the emergency program is on March 2022.
As soon as the meeting concluded, the EUR appreciated 68 bps to the USD, something which clearly shows that the market does not believe in the inflation transitoriness. Nevertheless, the monthly rebalances led the EUR/USD close the trading week at 1.1558 (-1.04%) (Refer to Figure 16). Similarly, the German Bund (10Y) and Buxl (30Y) reflected a flattening in the yield curve. As observed in Figures 17 & 18, the decrease in price in the former was three times that of the latter.


The velocity at which the yield curve is flattening is raising red flags among institutional investors as it has been the fastest flattening in the last decade. Take as an example the US 30Y-10Y yield (Refer to Figure 19). Other less relevant yield curves at the long end, like the 30Y-20Y, which have already inverted for the first time (See Figure 20), reflecting both the pessimistic macroeconomic outlook ahead and the investors’ progressive lose in faith in central bankers’ transitory assumptions. Figure 21 depicts yields by duration for different countries. The macro research newsletter “The Daily Shot” recently published the 1-month 1 OIS Forward Curve as of today compared to that 30 days ago. The OIS curve represents the market expectations of the Federal Reserve daily target for the overnight lending rate. As observed in Figure 22, investors are now pricing a significant increase in the curve.


US 2Y yields had its worst month in the last three years, questioning the Fed ability to restrain market expectations of a tightening monetary environment. This widespread panic is reflected in Figure 23, which shows how the US 2Y yield day move exceeded 5-sigma (Probability of occurrence of a 5-sigma event is about 1 in a 3.5 million). Another indicator could be the plummeting of the 3M Euribor futures, anticipating a higher probability of a hike rate by December 2022 (Refer to Figure 24).


By having a look at the 2Y yield technical charts of Australian and Canadian bonds (Refer to Figure 25), a parabolic increase took place after the announcement of a sooner-than-expected rate hikes. The 30Y-10Y spread has decreased 15 bps MTD, the steepest contraction since 2011. On top of that, the futures of the Federal Reserve Funds are showing a 75% probability of a rate hike by June 2022, coinciding with the hypothetical end-date of the asset purchase programme by the Fed.

Chinese Markets: Evergrande pays interest payment before the grace period deadline. Chinese equities underperforming MSCI World for nine months in a row.
The Chinese developer Evergrande Group has saved the second match ball after its last-minute offshore interest payment on a bond within the grace period (See Figure 26). This payment will satisfy dues worth $45.2 million that were not paid on September 29th. According to the company’s recent filling, total debt to cash & bank deposits ratio accounts for 1.48, with the former outnumbering the latter by CNY 78.4 billion. As of Wednesday, contracted sales between September 1st and October 20th were of CNY 3.65 billion, an insignificant amount compared to the CNY 142 billion reported in the same period last year. The Chinese authorities’ reluctance to bail out Evergrande makes the contagion effect to persist as smaller developers like Modern Land China, Sinic Holdings and Fantasia have already defaulted. Kaisa, with a $400 million payment due on December 7th, could be the next. Figure 27 depicts the evolution of Kaisa shares since 2017. Its bonds are currently trading at 50 cents. Actually, several global rating agencies have already slashed scores on 45 Chinese developers, something foreseen by Citi more than one month ago.


With regards to Chinese equities, they have lagged the MSCI world for nine months in a row, something last seen in 1993 (Refer to Figure 28). The gap started widening after the CPC 100th anniversary, when numerous regulations and reforms were announced as a response to slowing economic growth. This sense of uncertainty initiated a panic selling, aggravated by the later introduction of a not-for-profit model in the Chinese tutoring industry. Other sectors like tech, healthcare or consumer discretionary experienced massive drawdowns fearing further measures. Some months later, the indebted Evergrande exploded, and the real estate sector followed suit. Finally, the energy crisis has also taken its toll in China with power outages occurring in more than half of the Chinese provinces. All these events combined have brought about a pessimistic growth outlook for Q4. During the third quarter, US equities have outperformed MSCI China by almost 30%.
Despite the prevailing negative market sentiment towards China, I strongly believe the reforms following the “Common Prosperity” ideology will bring about a brighter outlook for the PRC. Thousands of jobs may have vanished after the tutoring industry reforms; Consumer sentiment data has reached a one-year low; PMI has contracted for the first time since the beginning of the pandemic. Yet, China envisions itself as a long-term leader, something which requires liquidity injections in order to boost the current slowing economy. In order to achieve this feat, China has pledged to decarbonization, heavily invested in the promising 4.0 industry and committed to tougher governance requirements. Unsurprisingly, the most common used word in their official documents is “restructuring”. Only time will tell whether the Common Prosperity bet produces its desired effects.

San Francisco’s gasoline prices soar to a new all-time high in the US
Expected to reach $5 per gallon by next month, gasoline prices in San Francisco are close to the record set in 2012. California is the US state with the highest tax rate on oil, accounting for 66.98 cents per gallon. As described in Figure 29, an extra 18.4 cents per gallon would be charged in concept of federal excise tax. As a matter of fact, hedge funds are currently betting on rising US gasoline prices with net-long positions in a nine-month high (Refer to Figure 30). Other institutional investors like Goldman Sachs remain bullish on the black gold, expecting WTI Crude Oil to surpass $90 by end-of-year.


Disclaimer: I have done my best to ensure that the information provided on this newsletter is accurate and provide valuable information. Nevertheless, the content is used for illustrative purposes only and does not constitute investment advice.
Before you leave…
I kindly welcome your feedback/suggestions/critics, etc to improve the usefulness of it to you. You can reach me at jramos@u.nus.edu. If you would like to receive the newsletters as they are published please subscribe. I also appreciate if you share it with your friends who are interested in this space. Thank you.