#08 Weekly market update (08/11/2021 - 12/11/2021)

Weekly performance:


Key takeaways:
Economic calendar. US October’s retail sales will provide further guidance on consumer sentiment. Crucial week ahead in the Euro zone as quarterly employment change and GDP data will be released. Moreover, CPI data (including that of members like Italy and France) may rebate the transitory narrative by the ECB. The UK will also witness a busy calendar with retail sales, CPI and PPI data being released.
Macroeconomic outlook. US CPI exceeds 6%, investors react by pricing rate hikes before mid-2022. Japan approves new stimulus package of JPY 40tn (≈$350bn), similar in size to that deployed during April 2020. University of Michigan’s Consumer Sentiment Index reflects worst economic conditions in the last decade. BofA’s transitory and persistent inflation meters signal historically high inflation.
Equities. Nasdaq’s short interest exceeds prior high from mid-July 2008. The S&P 500 concludes its eight-day streak of reaching new all-time highs, the longest since 1997 (65 YTD). Notional volume in stock options sets new record at $2.6tn.
Fixed Income. US 10Y-2Y yield curve restarts its flattening process, anticipating policy reversal leading to rate increases to lean against inflation. US5Y-30Y presents the narrowest gap since 2020.
FX. USD strengthens against major currencies after the release of the US CPI data. The Euro keeps signalling weakness, especially against the USD.
Emerging Markets. China’s PPI hits a 26-year high as coal prices soared 103.7% YoY amid a power crunch. Evergrande avoids default after last-minute payment, Chinese developer sector rebounds. Kaisa announces suspension of trading for all its units. Mexico, Peru and Uruguay rise rates to cope with increasing inflationary pressures.
Commodities. An exponential increase in the CPI’s fuel oil category anticipates the US to make use of its strategic oil reserves. Metals & mining and gold miners among the best performing sectors of the week. Arabica Coffee hits a seven-year high as poor weather, supply chain bottlenecks and soaring fertilizer costs keep threatening its supply.
Main world economic powerhouses witness soaring PPIs
Once again, macroeconomics has played a crucial role in the markets’ performance. On Tuesday, the US PPI data was released. Unchanged from the month prior and slightly below forecasts (8.6% YoY vs. 8.7% exp.), producer prices remain at the highest since 2010. Similarly, the latest monthly Survey of Consumer expectations by the New York Fed showed inflation expectations hitting an all-time high. The second largest economy also reported its PPI, which have reached a 26-year high as coal prices soared amid a power crunch (See Figure 1). The main components of the 13.5% YoY increase have been coal mining and washing prices (+103.7% YoY) as well as oil and gas extraction (+59.7% YoY). As a response, the government is currently evaluating a reduction in fees and taxes for business, especially SMEs, which account for 80% of urban employment, in order to deal with the surmounting pressure on costs. As analysed in #5 Weekly Market Update, the inflationary pressures are not being passed on to consumers, but through exports. Nevertheless, a message of the government advising citizens to keep storage of basic staples in case of emergency spread panic and long lines were quickly formed at the supermarkets’ stalls. As we can see in Figure 2, the CPI has soared 1.5% in October from a year earlier. Core CPI has increased 1.3% YoY, reflecting the decrease in food prices of 2.4% compared to October 2020. The main outlier has been the 15.9% YoY increase in the price of fresh vegetables.


But the biggest surprise has been the 8% YoY increase in Japan’s PPI (Refer to Figure 3). Being the biggest annual increase since 1981, the published data tripled the monthly expected increase (+1.2% vs. +0.4% MoM), leading to a substantial decrease in margins of Japanese manufacturers. As a matter of fact, only three of the twenty-three commodities that make up the Japanese PPI have dropped. The main contributors to the highest PPI since January 1981 have been petroleum & coal (+44% vs. +32.4% YoY last month) and utilities (+10.9% vs. +5.5% YoY prev.). Yet, the price of food and beverages, which is the largest contributor to the PPI, has decreased 2.3% YoY. The Japan Center for Economic Research, which is formed by 40 leading forecasters from private institutes in Japan, has revised down the Japanese Real GDP growth to +0.56% in their last monthly survey as a consequence of worsening retail sales, factory output and employment data. With regards to inflation, they expect CPI to increase to increase by 0.65% in FY2022 and 0.66% in FY2023. As a response, the Japanese government has recently approved a new economic stimulus package of JPY 40tn (≈$350bn), which will be comparable in size to that deployed last April at the start of the pandemic. The package will include JPY 100,000 for citizens aged 18 or younger, JPY 3tn among SMEs, JPY 2.5M among Covid-affected businesses, new issuance of government bonds as well as investments and loans to university funds, among others.

US CPI hits 6.2%, yield curve keeps flattening
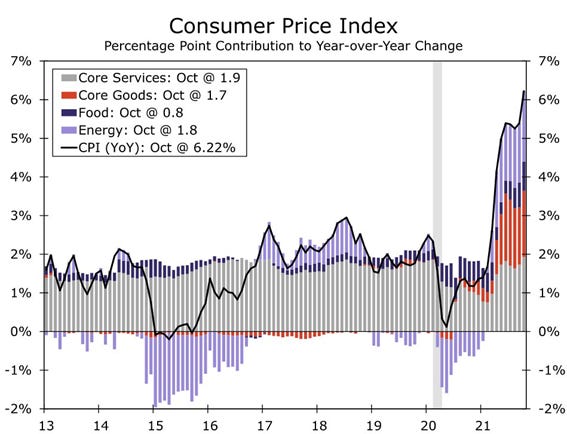
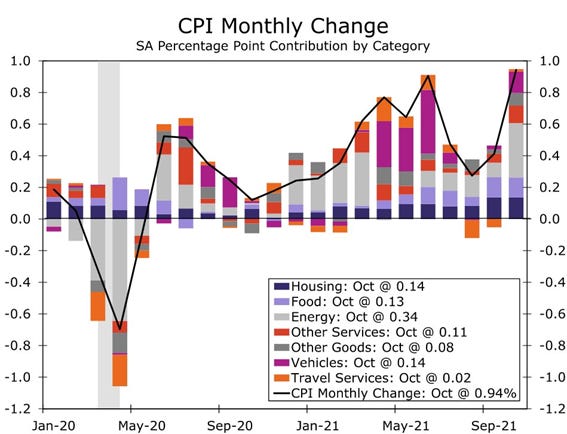
The long-awaited US CPI data was published on Wednesday and as expected, it beat analyst consensus (6.2% vs. 5.8% YoY exp.) and reached a 30-year high. Similarly, Core CPI soared 4.6% YoY, the highest increase since 1991. If we used the pre-1980 methodology, the CPI would currently account for 15% (See Figure 4). As we can observe from Figure 5, Energy and Used cars and trucks remain as the main contributors to the rising inflation. The main takeaway from the October’s CPI data is the significant increase in the price of oil, which has soared 12.3% MoM. Moreover, second-hand vehicles, as shown in the Manheim Used Vehicle Value Index, have surged 2.5% MoM after two consecutive months of decreasing prices. Beyond energy and cars, October registered abnormal increases in other categories like meat, poultry & eggs, tobacco, or electricity (Refer to Figure 6 for full disclosure).


Soon after the Bureau Labour of Statistics released the data, several investment banks flooded the market with reports and notes. One of these was Wells Fargo, who published historical CPI by categories (See Figures 7 & 8). Additionally, the San Francisco based bank also posted a heatmap of several indicators from February 2020 to November 2021. As we can observe in Figure 9, all of them have progressively shifted from greenish to reddish tones, showing the deteriorating macroeconomic outlook.

Bank of America also published its transitory and persistent inflation meters (Refer to Figure 10). While the former has been at 100 for seven months in a row, the latter has now equalled the persistent, showing historically high inflation. The interpretation for such a reading is that ongoing supply side challenges with port congestion, bottlenecks and delays, production disruptions, and the slow return of the labour supply are causing elevated inflation pressures which will last during the coming months.

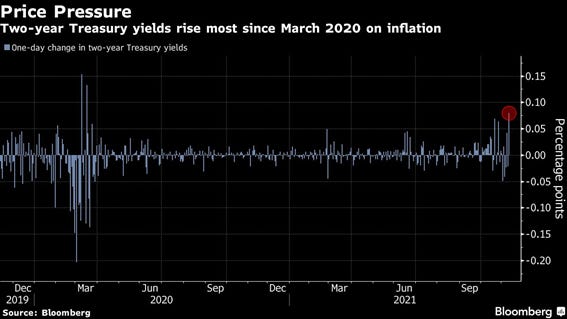
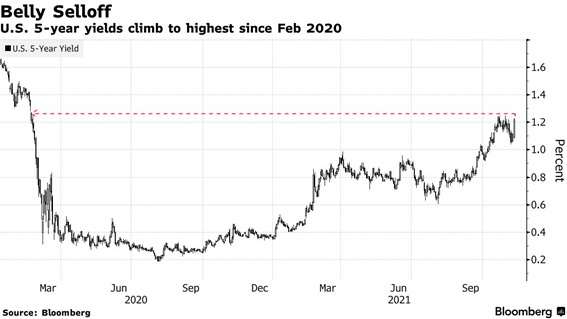
As usual, fixed income traders were the firsts in pulling the strings by pricing a Fed’s sooner-than-expected completion of the tapering process and, consequently, a hypothetical first rate hike before June 2022. On Monday, Bullard (hawk) called for 2 hikes in 2022. Similarly, Clarida (centrist/dove) said that a hike towards the end of 2022 is clearly possible. Hikes being raised in 2022 is becoming the consensus within the FOMC, something which was unthinkable a couple of months ago. As a result, the US yield curve resumed its flattening after the front leg (2Y and 5Y) yields skyrocketed (See Figures 11 & 12). On top of that, the $25bn 30Y bond auction turned out to be weaker than expected with a bid-to-cover ratio accounting for 2.2 (2.36 prev.). The yield paid was also lower at 1.94% (2.049% prev.). Figure 13 depicts the US 5Y-30Y yield curve, which presents the narrowest gap since 2020. Similarly, the 2Y-10Y yield spread steepened 2.3 bps to 103.6 bps. US30Y real yield at an all-time low at -0.6%.

Deutsche Bank expects the US 10Y to end 2021 at 1.80% (Currently at 1.5596%). As observed in Figure 14, The Merrill Lynch Option Volatility Estimate Index (MOVE), which measures US interest rate volatility that tracks the movement in US Treasury yield volatility implied by the current prices of one-month OTC options on US 2Y, 5Y, 10Y and 30Y Treasuries, has closed the week with a gain of 21.66%.

The USD also discounted a sooner-than-expected rate hike in early 2022 and immediately strengthened against the G-10 currencies. Despite its opening at 1.1593, the EUR/USD weakened and closed the Wednesday’s session at 1.1479.
With regards to oil, both WTI and Brent Crude have dropped 0.68% and 0.91%, respectively. As we can see in Figure 15, the week for oil investors has been a bumpy ride. While the WTI future hit $85, the second highest YTD, the release of the CPI made the Crude to take a nosedive given traders priced a possible Biden’s intervention in in order to cool rising energy prices. According to empirical studies, an increase of $10 in the price of oil translates into CPI rising 0.5%. For this reason, the President of the White House may make use of the US strategic oil resources, something which would be bearish for the Crude.

How do equities perform during hyperinflationary periods?
Monitoring the temperament of households is one of the main indicators of how the economy is performing. When consumers are likely to shop, travel and/or invest they indirectly contribute at keeping the economy on a roll. Conversely, then they are unhappy and insecure, economic activity can be derailed. Among the best-known indicators measuring the mood of consumers are the Conference Board’s Consumer Confidence Index and the University of Michigan’s Consumer Sentiment Survey (See Figure 16). While the former now stands at 113.8 (109.8 prev.), the latter has reflected the worst economic conditions in the last decade (66.8 vs. 71.7 prev.). Thus, the gap between both is currently increasing. We must bear in mind that these indicators won’t always show similar performances month to month given their different approaches. Conference Board questionnaires place more emphasis on household reaction to labor-market conditions, while the University of Michigan gauges consumer attitudes on financial and income situations, something which puts the Conference Board survey somewhat at a disadvantage as a leading indicator. Actually, the labour market tends to be very slow to react to economic changes. In addition, there may be a bias in the Consumer Confidence Index as questionnaires are mailed out around the time the government releases the unemployment report, leading to a possible psychological spill over when respondents fill out the survey. Yet, this is not the case with the University of Michigan’s Sentiment Survey as it dwells on personal income expectations, which ultimately are the most important driving force behind consumer spending. Another disadvantage of the Conference board is that it changes the entire sample every month, while the Sentiment Survey goes back to interview the same individuals it initially polled.

Back to the data, from the Sentiment Index we can observe an increasing fear of inflation and distrust towards its politicians’ response. Half of the respondents expect a decrease in real income in the next year. Moreover, the perception of price increases in the housing, vehicles and durable goods categories was the highest in the last 50 years. After this indicator was released, bonds partially undid the flattening trend initiated after the spike in October’s CPI. Nevertheless, equities were not severely affected after the announcement. Rather, the retail investors’ flows, the favourable stationarity and the institutional investors’ FOMO are driving current valuations to lofty fair values illogical levels. Last Monday, the S&P 500 concluded an eight-day streak of reaching new all-time highs, the longest since 1997. As a matter of fact, the index has doubled since its lowest point in March 2020, and YTD, it accumulates 65 new all-time highs. This permanent bullish trend perception is being reflected in investors’ minds, something which has led to irrational exuberance, even with inflation reaching its highest level during the last decades.
Acknowledging the current valuation of the S&P 500, its Schiller PE ratio current accounts for 39.51, the second highest ever. We must bear in mind that this ratio must not be taken as a golden rule, given the different macroeconomic conditions compared to these during the dot-com bubble, when the Schiller PE ratio reached its peak at 44. Figure 17 shows the drawdowns by valuation percentiles and as expected, the higher the ratio, the higher the forward maximum loss. As observed in this graph, current valuations suggest we are not currently in a favourable scenario to construct a generic portfolio given the exposure to huge potential drawdowns, which currently qualify for a “tail risk” or, said in other words, exceed 3 standard deviations (probability of occurrence ≈0.3%). Additionally, the S&P 500 real earnings’ yield has recently set a record low (Refer to Figure 18)


Goldman Sachs has published a report analysing the performance of equities during hyperinflationary periods since 1970. As observed in Figure 19, equities yield over 10% when inflation is bounded between 0 and 6%. Nevertheless, as long as inflation exceeds 6%, equities yield below 4%. The performance is even worse under deflationary periods.

It comes as no surprise then that some institutional investors may be starting to prepare their portfolios for a bumpy ride. Figure 20 shows the Nasdaq’s increasing short interest, which has recently exceeded the last high registered in mid July 2008. Similarly, the $VIX:$VXV remains below 0.8, which keeps indicating a spike in volatility in the next three months.

We must also bear in mind that the option expiry date will take place next Friday, something which has brought about higher-than-usual volatility in the last months. Figure 21 depicts the S&P 500 performance during the option expiry dates. As observed, in 7 out of the last 8 months the SPX performance has been significantly affected by the option expiry date. This suggests that there is every likelihood that a new volatility window opens from Tuesday onwards. Moreover, the notional volume in stock options has been setting new records ($2.6tn) in the last few days (Refer to Figure 22). According to Goldman Sachs, the single stock volume has been concentrated a small number of large-cap growth stocks and in very short-dated maturities. They also identified that the options volume is concentrated in areas of the market that are important to the SPX as a whole, with technology outnumbering the rest of sectors by 7 times (See Figure 23). As a matter of fact, Figure 24 shows how Tesla and Amazon represented more than half of all notional volume traded when single stock option markets set volume records last Thursday and Friday (4-5Nov).


Evergrande avoids default after last-minute payment of three bond coupons worth $148M.
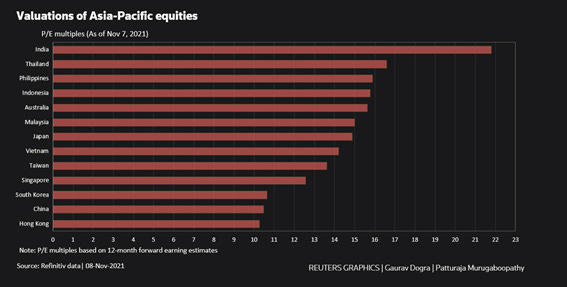
Macroeconomic data is showing an increasing likelihood of an economic contraction for The Red Dragon. Currently accounting for a 12-month forward P/E ratio of 14.59, Chinese equities have reached a 17-month low. To put things into perspective, the MSCI APAC is -0.6% YTD. Conversely, the MSCI US and MSCI World Indexes have soared 24.5% and 17.4% YTD, respectively. According to SocGen, the strong earnings published during the last two months’ have not fully convinced investors, who are already discounting stagnant EPS for the incoming fiscal year. If we take the P/E ratio as our benchmark, we can observe that Hong Kong is the cheapest market for equities (10.3). Korean and Chinese equities come as close seconds with P/E ratios of 10.5 and 10.6, respectively (Refer to Figure 25). While that ratio is popular and simple to calculate, it has big shortcomings that investors need to consider when using it to assess stock values. All said, it’s worth bearing in mind that an investing decision should not be solely dependent on one single indicator, given no single ratio can tell you all you need to know about a stock.
The Chinese developer contagion has kept spreading after the Fed’s warning of a possible collateral damage to the US economy. A few minutes later, the Chinese High Yield reached a new all-time high of 24% (See Figure 26). Similarly, China’s high-quality bonds are suffering their worst selloff in the last seven months after the spread having reached 1.80%. Nevertheless, further deterioration signals arose after Fantasia, a developer that had already defaulted a USD bond payment, resumed trading (Refer to Figure 27). In less than one hour, the stock plummeted an additional 50%. Currently, the stock trades at HKD 0.34 (-73.41% YTD).


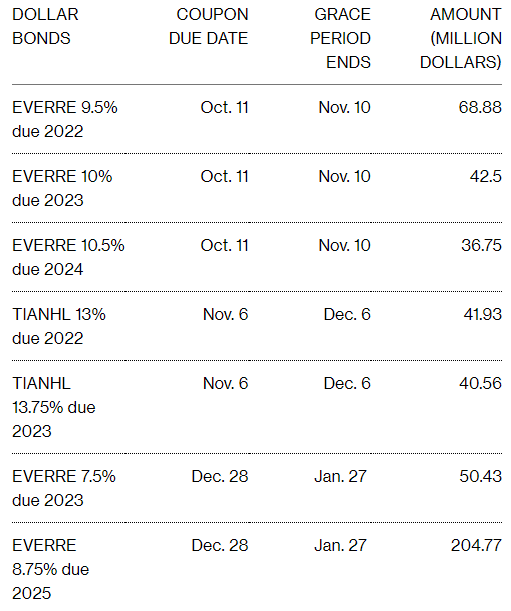
But the Evergrande’s 30-day grace period end for three more bond coupons has once again been the focus of the week (See Figure 28). Despite the German independent data service company (and bond investor in Evergrande) “DMSA” anticipated a default of the most indebted developer in the world by claiming that it had already failed to comply with its obligations during the grace period, Evergrande managed to avoid default again at the last minute. As a matter of fact, DMSA stated it had already started to prepare bankruptcy proceedings against the Chinese developer. Evergrande shares soared 9%, reaching a two-week high after avoiding bankruptcy, which led to a generalized rebound in the share prices of its peers (Sunac, China Overseas, Country Garden, etc.). Figure 29 shows the weekly returns of the “Premia China USD Property Bond ETF”.

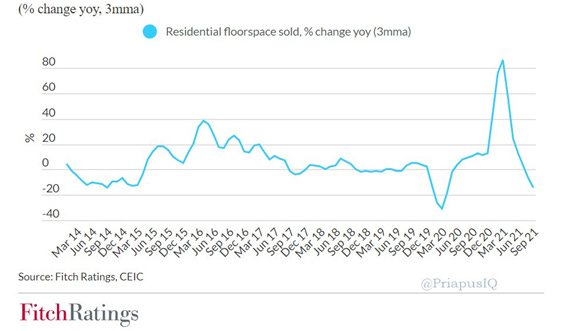
Kaisa, the second developer with the most offshore debt has pleaded for help from creditors this week. Both Fitch and S&P Global Ratings had already downgraded Kaisa last week given its decline in cash flow. The Chinese developer, which has $400 million outstanding debt in December and about $3bn in 2022, communicated trading suspension for all its units. As a consequence of the spreading contagion and the increasing number of countries/organizations warning of collateral damages in some of their public interest entities, Chinese regulators and government think tanks have decided to hold meetings with the developers in the last weeks in order to ease their credit and housing policies and hence, avoid a hard landing of the sector. Despite the property sector has been the key driver of Chinese growth in the last decades, China residential housing sales YoY increase has registered a new low since May 2020 (Refer to Figure 30). In my opinion, it’s unlikely that the government would stomach the impact on growth from allowing so many developers to fail. Thus, I expect Beijing either to ease up on the property sector, boost infrastructure spending or assume much slower growth.
Mexico, Peru and Uruguay tighten monetary policies to tackle above-target inflation
Unlike the Federal Reserve and the Bank of England, some emerging markets have been aggressively boosting borrowing costs this year in order to cope with the increasing inflationary pressures (Refer to Figure 31).

With inflation exceeding 6%, the Bank of Mexico decided to hike interest rates by 0.25%, the fourth since June. The recent GDP contraction of LATAM’s second largest economy is placing Mexico between the Devil and the deep blue sea. As a result, the bank has been cautious on the rate hikes. With a current target inflation of 3%, Banxico expects inflation to peak in 2021, and progressively stabilize in Q4 2022 (See Figure 32).

On Thursday, Peru announced its decision to hike rates from 1.5 to 2%. The world’s second largest copper producer is currently witnessing how inflation spikes at the fastest pace in more than 12 years. Unlike Mexico, it may close the year with a growth of 13.2% YoY, posting the highest expansion in decades. Sergio Armella, an economist at Goldman Sachs, had already predicted the 50 bps increase as a result of the robust growth, higher than expected inflation and the increased inflation expectations by consumers. The central bank expects inflation to return to the target rate (2-1%) in the second half of 2022 (Refer to Figure 33).

Uruguay is also facing skyrocketing inflationary pressures after its annual inflation reached a seven-month high of 7.89% in October. A sharp increase in the price of food and transportation costs led to the second-biggest monthly increase YTD (See Figure 34).

Arabica Coffee hits a seven-year high given output shortages
As poor weather, supply chain bottlenecks and soaring fertilizer costs keep threatening the Arabica Coffee supply. Arabica futures for March delivery have reached the highest since October 2014 (Refer to Figure 35). Technical analysis suggests that in case prices broke the $2.25 resistance, Arabica could rapidly surge to $3. Brazil and Colombia, which provide 75% of the world supply, are being severely hit by extreme weather conditions. On the one hand, Brazil’s droughts have significantly cut output, whomst recovery relies on an increased rainfall. On the other hand, Colombia has been affected by unusual heavy rains, which have cut yields and heightened the risk of plant disease. The increasing freight costs and lack of container ships are hindering producers’ efforts to export beans, who see their profits eroded.

Disclaimer: I have done my best to ensure that the information provided on this newsletter is accurate and provide valuable information. Nevertheless, the content is used for illustrative purposes only and does not constitute investment advice.
Before you leave…
I kindly welcome your feedback/suggestions/critics, etc to improve the usefulness of it to you. You can reach me at jramos@u.nus.edu. If you would like to receive the newsletters as they are published please subscribe. I also appreciate if you share it with your friends who are interested in this space. Thank you.