

#09 Weekly market update (15/11/2021 - 19/11/2021)

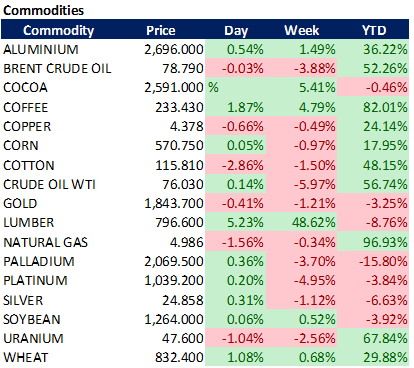
Weekly performance:


Key takeaways:
Economic calendar. US 2/5 year note auctions will provide further guidance on fixed income markets. Euro zone PMIs will reflect economic sentiment. Germany and the US will publish their GDP growth. PCE, the favourite inflationary measure by the Fed, will be released next week.
Macroeconomic outlook. The UK’s Inflation and PPI reach a new 10-year high. Austria announces national lockdown and wreaks havoc on the markets. Christine Lagarde reinstated that there won’t be any rate hike in the present year, European markets have witnessed a tumultuous end-of-week. Germany’s PPI shows the largest increase since November 1951. 65% of the respondents of the monthly BofA’s global fund manager survey believe inflationary to be transitory.
Equities. European equities trading at a record discount compared to its US peers. NASDAQ Composite witnesses two Hindenburg Omen signals. Fear and Greed Index cools down, institutional investors progressively reducing exposure to equities. Positive corporate news by NVIDIA and Apple propel the NASDAQ, ending the trading week with a gain of 1.02%.
Fixed Income. High-grade bond ETF sees $1.5bn drawdown in one day, second largest outflow ever. German bonds skyrocket as a response of ECB’s dovishness.
FX. Turkish Lira keeps plummeting and cumulates an 80% loss against the USD. JPY re-activated again its hedging role and appreciated by 1% against the EUR. The EUR continues its depreciation against the USD (-7.51% YTD).
Emerging Markets. South Africa and Thailand, the only developing countries containing inflation inside its target. Moody’s expects Chinese developers bond defaults to continue to rise in 2022.
Commodities. US Coal prices surge to highest point since 2009. Hedge Funds are the longest in Gold since December 2020. Goldman Sachs expects the price of the bullion around $2,300. WTI and Brent Crude Oil plummet after Biden demands some of the world’s largest oil consuming countries to initiate a coordinated release of stockpiled oil in order to cope with rising prices.
Inflation keeps increasing while central banks stick to the “transitory” narrative
Inflation in the UK has recently hit a 10-year high (+4.2% YoY), increasing by 1.1% MoM (See Figure 1). Figure 2 shows the main contributors to the higher-than-expected inflation. As observed, the three most significant drivers are identical to those of the US data (Fuel, used vehicles and electricity). As a matter of fact, gas prices paid by British consumers are 28.1% more costly than in October 2020. The silver lining of the week for the UK’s economic data has been retail sales, which have grown 2% MoM. Yet, chances are the BoE will be the first major central bank to hike rates since the Covid pandemic started. Despite the BoE governor, Andrew Bailey, surprised investors by announcing the decision of keeping interest rates on hold at 0.1%, the immediate market reaction after the data was published led the British pound to appreciate 73.5 bps against the USD. Future markets are currently not only pricing a 15 basis-points rate hike on December 16th, but also a 66.66% chance of an additional 25 basis-points hike in February 2022, which would mean rates equalling 0.5% compared to the current 0.1%.


Nevertheless, this was not the only inflationary signal. Manufacturers’ input costs soared by 13%, the highest since 2008. Similarly, producers’ price index (PPI) had the sharpest increase since 2011 after increasing 8% YoY. When interviewed, several asset managers have stated that inflation will force central banks to act appropriately in order to avoid the disastrous consequences that a rising inflation may have on consumers. As a result, most of them take for granted that the first-rate hike will have already taken place by the end of the year. The BoE’s forecasts are currently showing inflation exceeding 5% in the coming months before reaching its peak.
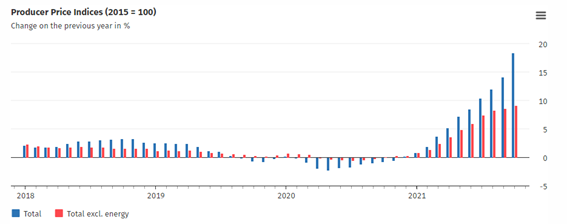
Similarly, Germany has reported its PPI, which has soared by 18.4% YoY (+14.2% prev.) Mainly distorted by the skyrocketing energy prices and persistent supply disruptions, October’s PPI has accounted for the largest increase since November 1951 (Refer to Figure 3).
When it comes to emerging markets, inflationary pressures are also taking its toll in central banks’ policy making. As observed in Figure 4, South Africa and Thailand are the only developing countries containing inflation inside its target. Notable amongst these is the inflation rate in Turkey, where another intervention of its president has caused the Turkish Lira to further depreciate. Since 2014, the Turkish Lira has lost 80% of its value against the USD (-40% YTD). This week, its currency has fallen to a record-low after Erdogan pushed the central bank to cut interest rates so as to boost lending and growth (See Figure 5). With inflation surpassing 20% and immersed in the middle of a currency crisis, the Turkish Central Bank has been slashing interest rates (3% since September), obeying the instructions of its country’s president, who believes that high levels of interest rates are the root of the problem. As a result, these counter-intuitive drastic economic decisions have brought Turkey under a massive currency crisis, converting the Turkish Lira in the cheapest world currency according to Deutsche Bank. Actually, the cost of hedging has skyrocketed since early October. Figure 6 depicts how the premium on 1-month options to sell the Turkish currency against the USD has soared 7%. According to investors, another 100-bps cut is inevitable. In the same report, the German bank also advised of a possible contagion effect into oil-importing countries like India.


Austria imposes national lockdown starting on Monday
Days after Austria had applied a segregationist policy between vaccinated and non-vaccinated, it has announced a 20-day full national lockdown from Monday onwards. Additionally, getting vaccinated will be a mandatory requirement from February 1st, 2022. Germany’s Minister of Health has acknowledged a worsening situation and did not discard taking a similar measure. Combined with the press conference by the ECB president, Christine Lagarde, who has reinstated that there won’t be any rate hike in the present year, European markets have witnessed a tumultuous end-of-week. The EUR, which was already under bearish momentum, collapsed losing 101 bps against the USD. Similarly, the JPY re-activated again its hedging role and appreciated by 1% against the EUR. As observed in Figure 7, the EUR has continued its depreciation against the USD (-3.29% MTD; -7.51% YTD). We must bear in mind that a depreciation of the local currency benefits the local exporting companies as its goods become cheaper to buy. From a macroeconomic point of view, the depreciation of the Euro has the same effect as interest rate cuts.

Conversely, the German bonds initiated a hedging role and immediately soared, which brought about the US counterparts to follow suit (See Figure 8).

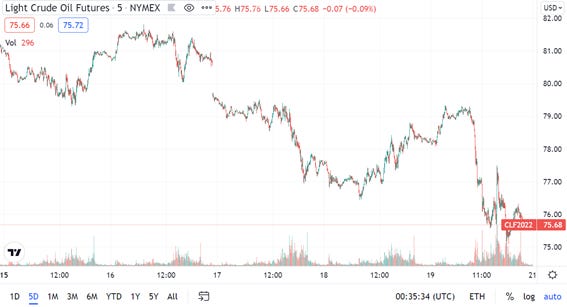
Bearish week for the black gold
Despite yielding +51% and +56% YTD respectively, Brent Crude Oil and WTI Crude Oil have witnessed one of the worst trading weeks since August (Refer to Figures 9 & 10). After a frustrating negative by OPEP countries to ramp up oil production, J. Biden has requested some of the world’s largest oil consuming countries to initiate a coordinated release of stockpiled oil in order to cope with rising prices. Surprisingly, China, who is the world’s second largest importer of oil, has also been included in the formal petition. In order to such an unprecedented, bearded reaction against OPEC to be effective, the US would need to make use of 20-30 million barrels. As of today, no country has officially replied to the Biden’s administration petition. The Japan’s Ministry of Industry claimed the US having asked for cooperation but assured that the current regulations prevent Japan from making use of reserves in order to lower prices. Similarly, South Korea clarified that they could make use of oil reserves as a result of supply imbalances but not as a response to soaring oil prices. Yet, as we can observe in Figure 11, the spread between the WTI Crude Oil and the Middle Easter Dubai Oil is narrowing, suggesting that Biden will have no other choice but to release part of the national oil reserves.


Currently, the average price per gallon in the US accounts for $3.41, which represents a 60% increase YoY. Moreover, as discussed in #08 Weekly Market Update, a $10-decrease in the price of oil contributes to a reduction in inflation of about 50 bps. For this reason, as the 2022 midterm elections approach, the Biden administration will have no other choice but to do whatever it takes to keep inflationary pressures under control.
Goldman Sachs analyses hedge funds’ bets
Goldman Sachs has recently published a paper analysing the portfolios of hedge funds (sample of $3tn) and its most popular bets. Goldman highlights the so-called “VIP” values, being $MSFT, $AMZN, $META, $GOOGL and $CRM the leading five of the 50 values comprising the list. These VIP bets have outperformed the S&P 500 in 6 out of every 10 quarters since 2001 with an excess average yield of +61 bps. The NY-based bank has identified 14 new components: $APO; $ATH; $BKNG; $CZR; $DELL; $ESTC; $FIVN; $KKR; $NFLX; $NOW; $TDG; $UNH; $WDAY; $WSC.
The sampled hedge funds have reported an increased exposure to tech, cyclical, and energy sectors while reducing its stake in health care. Nevertheless, their exposure to Info Tech is now the lowest since November 2019. Moreover, when it comes to the classic value vs. growth dilemma, HF inflows into growth have been the lowest since early 2015, something unusual for them as they tend to be “wave surfers”. Figure 12 shows the short interest for the median S&P 500 stock, which remains at a similar value than before the 2000s dot-com bubble.

So… what is going on with equities?
As observed by Goldman Sachs, Hedge Fund bets are showing a generalized decrease in risk appetite. In #07 Weekly Market Update we recommended going long on ETFs like “EAFE”, which cover the world developed economies excluding the US given the current irrational exuberance on American equities. Figure 13 illustrates the PE of the MSCI Europe Index compared to that of the MSCI USA as of last week. As we can observe, European equities have reached a record low. Yet, this does not mean that European valuations are “cheap”. Rather, it just means that European equities are way less overvalued than its US counterparts. From a macroeconomic point of view, Europe is also better positioned than the US given: 1) the weak momentum of the EUR benefitting exporting companies; 2) Lagarde stating no rate hikes expected until 2022; 3) European earnings’ campaign has turned out to be better than that of the US.

Moreover, Goldman Sachs has also published a paper expecting the S&P 500 to end 2022 at $5,100 (+9% with respect to current price; 10% including dividends). They expect EPS to grow by 8% to $226 and by 4% to $236 in 2023 as a result of companies’ expansion of profit margins despite input cost pressures and supply chain bottlenecks. Yet, their alternative scenarios suggest there is a high uncertain ahead. Their worst-case scenario expects slower growth and higher inflation which would make the S&P 500 plummet by 25% to $3,500. In any case, they believe the equity market concentration will keep increasing and the S&P 500 performance will be extremely dependent on its largest contributors ($META; $AMZN; $MSFT; and $GOOGL), which account for 23% of its market cap and 17% of its earnings. Overall, their investment recommendation relies on going long on Covid and inflation sensitive sectors, avoid high labour cost firms and buy growth stocks with high margins. Their preferred sectors for the first semester of 2022 are technology, financials, and health care.
This week, the NASDAQ index has outperformed the S&P 500, which has been affected by the options expiry date. Another important event which has affected the S&P 500 is the rotation which has been contributing to an increasing spread between the RSP and SPY Indexes. As we can observe in Figure 14, the divergence between these two is being originated because of a higher number of S&P 500 components underperforming the “FAANG” stocks, which means broad indexes are distorting the reality. Similarly, positive corporate news by $NVDA and $APPL have boosted the technological Index, which has closed the trading week with a gain of 1.02%.

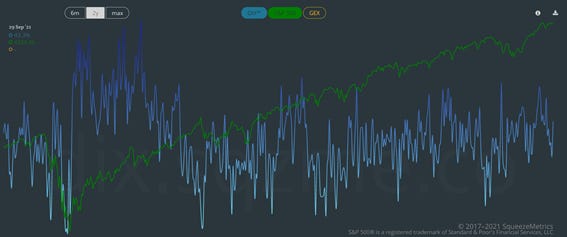
With regards to the market structure, retail investors are currently flooding the market with daily inflows of +$15 billion. On top of that, the favourable seasonality of corporate buybacks is also contributing to the bullish sentiment. Nevertheless, the Dark Pool Index shows us that during this last week, institutional investors have been selling while the S&P 500 kept with his positive momentum (Refer to Figure 15). Additionally, BofA’s monthly global fund manager survey ($ 3.1tn AUM) showed a decreasing inflow into equities (See Figure 16). In that same survey, only 35% of its respondents do believe inflationary to be non-transitory, something which could trigger a severe drawdown in case data dismantled the popular belief. Figure 17 shows how the inflation expectations by these surveyed asset managers has drastically changed since its recent heights in April 2021. As of today, a net 14% of investors now expect global inflation to be lower, the lowest level since the onslaught of the pandemic in March 2020 or, said in other words, 51% of the investors expect lower inflation while 37% expect inflation to be higher.


More indicators showing the equities’ momentum to be cooling down is the “Fear & Greed” Index (Refer to Figure 18), which has shifted from 82 (Extreme Greed) to 71 (Greed) in one week.

Two Hindenburg Omen spotted in the NASDAQ Composite during the last days.
Before we analyse the implications of this technical pattern, we will first introduce what a Hindenburg Omen is and why is it important in technical analysis. Named after the May 6th , 1937 German airship disaster, it was invented by Jim Miekka. In order to give a Hindenburg Omen as valid, some conditions must be met. First, the NYSE Composite Index’s 10-week moving average must initiate a rising trend. Second, the McClellan Oscillator must be below 0. The next condition relies on the number of stocks on new-highs / new-lows. According to Miekka, a value greater than 79 will provide a higher reliability. Once these conditions have taken place, we need to divide the lowest of these numbers (new highs vs. new lows) by the total amount of tickers and multiply by 100. Only when the obtained value is higher than 2.2, we will consider such an event a Hindenburg Omen. Some years later, McHugh introduced some extra layers in order to further refine the indicator. The first extra condition was that the number of NYSE’s values reaching a 52-week high should not double the amount of these reaching 52-week lows. Additionally, Hugh considered a Hindenburg Omen to have taken place if and only if these conditions were met twice in a timespan of 36 days. Given all these requirements, he concluded that when a Hindenburg Omen signal takes place, there is a 41% of probability of a crash (>=15%); 54% of an 8% drawdown; and 77% of probabilities of the Index decreasing by at least 5%. As we can observe in Figure 19, every time a Hindenburg Omen has taken place, the NASDAQ Composite has witnessed a market correction. Whether this occasion will be different is something only time will time. What we know so far is that the NASDAQ has shown two of these signals in the last days. Moreover, the number of new lows in this Index has reached a new record since 1999, months before the dot-com bubble. At the same time, NASDAQ has reached a new 52-week high (Refer to Figure 20).


Moody’s expects Chinese developer defaults to continue to rise next year
Moody’s Investors Service has recently released a paper outlining a higher likelihood of Chinese Corporate bond defaults increasing by next year. Year-to-Date, onshore defaults by Chinese non-financial companies soared by 19% to CNY 98.7bn ($15.5bn), while offshore defaults rose 28% to $7.8bn as a result of tightened funding access and increased risk aversion by investors. Beijing measures, also known as the “three red lines” difficulted overleveraged developers to being granted new banking loans, drying an important source of liquidity. Other developers like Fantasia Group Holdings, Modern Land and Sinic Holdings Group, have already defaulted on their offshore debt while Evergrande is still saving match balls, thus avoiding the bankruptcy (See Figure 21).

In the next year, CNY 8.7tn of onshore corporate debt is expected to mature, 18% of which is held by relatively weak companies. In my opinion, authorities will intervene if they see signs that bond defaults will rise significantly or are likely to trigger systematic risk. Actually, unless Beijing is willing to accept a very sharp slowdown in growth, they cannot allow an interruption to the rapid expansion of credit.
Unlike UBS, Goldman Sachs and Bloomberg are bullish on the bullion
As the inflationary pressures keep gaining momentum, the USD is increasing its outperformance with respect to other major currencies. Nevertheless, Gold has not followed the historical negative correlation with the greenback. Rather, it has acted as an inflationary hedge. Additionally, Goldman Sachs has posted a paper expecting Gold to reach $2,000 in the next months. Figure 22 depicts the rationale of the investment idea. According to Goldman, their objective of US 30Y yields accounting for -1.10% implies a price of the bullion around $2,300.

Bloomberg also commented that gold could outperform the S&P 500 Index by 20% if the threat of stagflation becomes real. To strengthen their argument of gold being undervalued they have combined the positive correlation between real yields and gold (R2 = 0.91) with technical analysis. When observing the Bollinger Bands we can see the candle breaking out of the upper trading band while the bandwidth is creating a volatility squeeze, which suggests a significant increase in volatility ahead, something favourable for the bullion. They conclude that there have been give cases in which gold has crossed over its 20-week MA with bandwidth below 6 over the past two decades. On average, gold has outperformed the S&P 500 by 19% over the next 52 weeks with no losing record.
Yet, the Swiss bank, UBS, seems not to be as optimistic with gold. Despite UBS expects risks for further strength in CPI in early 2022, something which could crush demand for gold, they also observed the recent hawkish reaction by the Fed caused a flattening of the US yield curve, only adding to gold’s shine. As a consequence, the Swiss bank raised its target price from $1,700 to $1,800 but they outlined the risks being skewed to the upside in the short run. Moreover, hedge funds are the most bullish on gold since December 2020 (Refer to Figure 23).

Disclaimer: I have done my best to ensure that the information provided on this newsletter is accurate and provide valuable information. Nevertheless, the content is used for illustrative purposes only and does not constitute investment advice.
Before you leave…
I kindly welcome your feedback/suggestions/critics, etc to improve the usefulness of it to you. You can reach me at jramos@u.nus.edu. If you would like to receive the newsletters as they are published please subscribe. I also appreciate if you share it with your friends who are interested in this space. Thank you.