

#10 Weekly market update (22/11/2021 - 26/11/2021)

Weekly performance:


Key takeaways:
Economic calendar. All eyes on the main Euro Zone countries’ (Spain, Italy, France, and Germany) CPIs, which will provide further guidance on the inflation perspectives. Similarly, European Manufacturing PMIs will be released by mid-week. Japanese Retail Sales will give more insights into Asian Consumer Sentiment. Canadian and Australian GDP data may show signs of economic recovery. The most relevant US macroeconomic data will be the Consumer Sentiment and the ISM Manufacturing PMI. Similarly, Crude Oil Inventories may spike volatility in the Crude Oil.
Macroeconomic outlook. Joe Biden re-elects Powell as the Fed’s President for the next four years. German IFO data deteriorates for a fifth month in a row. German employers and the Bundesbank expect the economic situation to worsen during the next six months. Spanish PPI hits an all-time high after increasing 31.9% YoY. US PCE data soars at the highest pace since January 1991.
Equities. Hedge funds replace pricy software and internet for high-beta stocks. NYSE Ticks indicator shows an uncommon divergence. Dark Pool Index reflects a soaring DIX in the mid of the Friday’s sell-off. Goldman Sachs identifies that almost half of stock pairs of the top 50 constituents of the S&P 500 have had negative correlation with each other in November. Implied volatility currently trading at a higher level than the 20-day realized volatility, something which did not occur since 2017. The cost of tail-risk protection at its highest since 2018.
Fixed Income. “Black Friday” triggers a rebound of US Treasuries after market participants discount a delay of the Fed’s rate hike. Goldman Sachs detects realized volatility in the bond market to be one of the highest in the last years, ultimately contributing to the present high implied volatility in equities.
FX. Turkish Lira slumps 12% to 12.77 per USD after Erdogan’s intervention. Swiss Franc re-activates its hedging role, being closer to parity with EUR. The outbreak of the new Covid variant initiates selling pressure on the USD.
Emerging Markets. Apple announces the temporary suspension of its products in Turkey. Asian markets slightly affected by the Omicron variant outbreak.
Commodities. US announces the liberation of 50 million barrel which, combined with that of its counterparts, translates into 15.5h of global consumption. UAE and Russia communicate they are currently considering interrupting the increase in the oil production in retaliation for Biden’s strategy. Friday’s sell-off leads to WTI Crude Oil having its worst daily drop since June 2020, when it went to negative.
Jerome Powell re-elected: Market starts pricing a faster-than-expected tapering process after FOMC Meeting Minutes
On top of this week’s crowded economic calendar, all eyes were on the outcome of the Brainard – Powell decision. Finally, Joe Biden announced the re-election of Powell for the next four years. The outcome surprised market participants, who saw Brainard better qualified to lead the Federal Reserve. Yet, American bankers preferred the status quo given Lael’s proclivity towards. Additionally, Brainard has opposed more than 20 times on regulatory policy votes and has promoted the introduction of a counter-cyclical capital buffer that would exceed existing capital requirements. The Community Reinvestment Act has also been one of the top priorities of the former Secretary of the Treasury for International Affairs who served during the Obama Administration. BNP Paribas, who expected Brainard to be the Biden’s pick, relied on the message on diversity that her election would send to the markets given she would be the second woman to hold the Fed chair job after Janet Yellen, who served from 2014 to 2018.
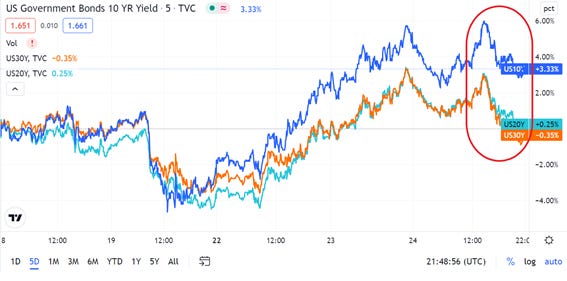
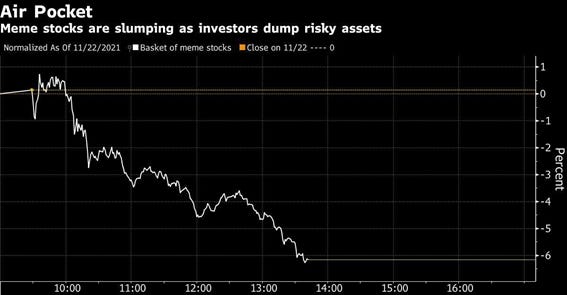
On Wednesday, the FOMC Meeting Minutes left the door open for a faster tapering process and thus, sooner-than-expected rate hikes. The new vice-chair Lael Brainard clearly emphasized that combatting inflation is now the primary target of the FOMC. As a matter of fact, her opening remarks were: “I am committed to putting working Americans at the centre of my efforts at the Federal Reserve. This means getting inflation down at a time when people are focused on their jobs and how far their paychecks will go”. Several other Fed members stated that they would be open to adjust the Fed’s scaling bank of its asset purchases if inflationary pressures remain over the target. Recall that according to the original repurchasing schedule, the tapering process would be completed by June 2022. Given the worsening inflation levels and the improving employment data (lowest since 1969) since the last meeting, an increasing number of Fed members have been demanding a faster tapering. For this reason, chances are this confirmation will be announced at the Fed’s next meeting, which will take place on December 14th-15th5. As we can observe in Figure 1, the US bonds reacted positively to the Powell’s re-election. Conversely, the major US equity indexes plummeted after the announcement (Refer to Figure 2). When it comes to the market structure, hedge funds have replaced pricy software and internet for high-beta stocks. Additionally, the so-called “MEME” stocks witnessed a drawdown as investors flew growth stocks (See Figures 3 & 4).


Turkish Lira plummets 12% in a single trading day
On Tuesday, the Turkish Lira slumped 12% to 12.77 per USD after its president addressed the nation on a late-night televised programme (Refer to Figure 5). Erdogan, who had declared himself an “enemy” of high borrowing costs, portrayed his economic policies as “an economic war of independence”. The Turkish president stated: “Either we were going to give up on investments, production, growth and employment by keeping to the understanding that has prevailed in our country for years, or we were going to engage in a historic struggle in line with our priorities”. With inflation running at an annual rate of 20%, Turkish citizens flooded the streets to protest for the spike in unemployment, cost of living and the eroding purchasing power. Some hours after the plummeting of the Turkish Lira, Apple announced the temporary suspension of its products in Turkey. Similarly, State banks in Turkey started selling USD in order to help satisfy the increasing demand of currencies.

As we can observe in Figure 6, other emerging market currencies namely the Polish Zloty, Argentine Peso, Chilean Peso, etc. have plunged this year.

Biden’s strategy of the US Strategic Oil Reserves liberation backfires and oil futures rebound
It has been slightly more than one week since Joe Biden formally requested China, India, South Korea, Japan, and the United Kingdom to carry through a coordinated liberation of strategic oil reserves in order to cool down oil prices after OPEC members disregarded the White House’s request. During the last press conference, Biden stated that OPEC countries already know that the US will take measures on this issue and asserted that is what the Administration is doing. He also reassured that it may take some time until the decrease in the price of oil is perceived in gas stations. Before concluding the meeting, he also reminded his ambitions of a transition towards clean energy. To put things into perspective, the crude oil is trading at the highest in the last seven years, accounting for a 60% increase YoY (fastest increase since the 2000).
During this week the US has announced the liberation of 50 million barrels, which may be capped at 30 million due to legislated limits; China may sell at least 7.33 million barrels; the UK and India have announced liberations of 1.5 and 5 million barrels, respectively; and Japan has committed to liberate “some hundred thousand kilolitres” but has not specified the concrete date yet. All this combined account for only 15.5h of global consumption. According to C. Bain, a commodities’ leading economist at Capital Economics Ltd, the number of barrels liberated is not sufficiently high so as to drive oil prices down and may even be counterproductive in case the OPEC reduced the pace at which it is raising production. Another factor which contributed to the oil futures prices rebound has been the uncertainty on China’s decision. (Refer to Figure 7). Similarly, Brent Crude Oil futures soared 3.3% to $82.31 per barrel.

On the other side of the equation, the OPEC members, who expect the resurgence of Covid to affect the demand of oil, will meet again on December 2nd in order to revaluate their policy. The day after the official announcement of the strategic oil reserves’ liberation, the UAE and Russia communicated they are currently considering interrupting the increase in the oil production in retaliation for Biden’s strategy.
European Equities affected by weak macroeconomic data and Covid variants. Its American counterparts show resilience to the highest PCE in the last 30 years, new Covid variant (Omicron) triggers a sell-off magnified by the Thanksgiving holiday.
All eyes were on the US Personal Consumer Expenditures (PCE), which is the Fed’s preferred inflation gauge. Unsurprisingly, the data revealed the highest increase since January 1991. As we can observe in Figure 8, the PCE Index for the month of October soared 5% YoY, with Energy prices skyrocketing by 30.2% while food prices increased 4.8%. By excluding food and energy, the PCE Index increased 4.1% from one year ago. The main takeaway of the data is that personal income soared by a stronger-than-expected 0.5%. Similarly, personal spending rose 1.3%, beating economists’ forecasts.

When it comes to European markets, the week started with the release of the German IFO data, which deteriorated for the fifth month in a row as a consequence of the ongoing bottlenecks in the manufacturing sector as well as the Covid’s fourth wave. Not only German employers reported a decrease in the current business sentiment, but they also expect the situation to worsen during the next six months. As a matter of fact, the Bundesbank announced on Monday that the German economic growth for the last quarter may be lower than forecasted in June as a result of the goods & labour shortages and the new restrictions to fight the pandemic. Its president, Jens Weidmann stated that German inflation will peak at 6% and it won’t be until end of 2022 that inflation will fall below 3%. Nordea has already run the linear regression between the German GDP and the IFO expectations for the next 6 months. As we can observe in Figure 9, the latter has fallen back to below zero. On the other hand, the German GDP, which had strongly rebounded after the pandemic mainly because of the weak benchmark, is currently at 2.5%. As Nordea points on the graph below IFO expectations tend to lead by 4 months, something which could translate into negative GDP growth in 2022.

Other economic data which has weakened the performance of European equities has been the Spanish PPI, which has hit an all-time high at 31.9% increase YoY (+23.8% prev.). Mainly disrupted by soaring energy prices, the indicator showed the highest increase in Spanish producers’ costs since 1976, when it was first calculated (Refer to Figure 10). If we exclude energy, producer price inflation has increased 9.7%, the strongest since 1985 (+8.8% prev.). But, which are the consequences of this reading? In order to properly assess the economic consequences, we must first understand the business dynamism in Spain. According to Informa, SMEs accounted for 97% of the Spanish business textile pre-Covid. Of these, 94% corresponds to micro entities (1-9 employees). By sectors, services represent almost three thirds of the overall business output, followed by construction and agricultural sectors, which account for 11.33 and 9.43%, respectively. Already disrupted by the pandemic, SMEs and freelancers have now to cope with rising costs. In case companies manage to absorb these increases, inflation will undoubtedly soar. Conversely, if these companies decide to pass the increasing costs to consumers, social unrest will translate into a deadly wage-price spiral, which will in turn drive inflationary pressure (even more) upwards. As a matter of fact, the second scenario implies that only the enterprises with the higher pricing power will survive and, as a result, the most vulnerable will be left behind, contributing to a reduced Spanish economic growth.

As analysed in #09 Weekly Market Updates, European equities are currently trading at record discount compared to its US counterparts. Nevertheless, this does not imply EU stocks to be “cheap”. Rather, they are simply less overvalued than the American peers. But if there is something which has undoubtedly affected the European equities’ performance, this is the Covid outbreak in many European countries, which has not confirmed any new case from the new variant yet. On Thursday, Israel reported its first case of the new “Omicron” variant originated in South Africa. Similarly, the United Kingdom included six African Countries in its “red list”. Some hours later, the Euro Stoxx 50’s futures plummeted by almost 4% (Refer to Figure 11). The generalized panic led to Asian markets kickstart a selloff. As a matter of fact, the Japan’s stock market had its worth day in nearly two months with most of its travel stocks falling by more than 10%. Other major Asian indexes have been down 1% (See Figure 12). As Asian Markets were bringing its trading week to an end, its bearish sentiment rubbed off on European markets, which were already affected by the previous variants, with many of their indexes rebounding on the 200-MA. Finally, Wall Street indexes reproduced a crash structure which had not been seen since March 2020, when the pandemic was declared out of control. Figure 13 depicts the heatmap of the S&P 500 Index with most of its components in red except for Pfizer, Moderna, Netflix and some other “hedges”. One of the most violent spikes was that of the oil, which discounted a sharp decrease in demand as a result of the new variant. As we can observe in Figure 14, WTI Crude Oil futures slumped 13%, being Friday its worst daily drop since June 2020 when WTI entered the negative zone. Another instant market reaction was the plummeting of the USD after market participants discounted a delay of the Fed’s rate hike, which in turn led to an appreciation of both: the EUR (+91 bps) and the US Treasuries (See Figure 15). Moreover, the Swiss Franc re-activated its hedging role with inflows of 94 million CHF and VIX spiked topping 28 at its peak.


Whether this is a manipulated market movement will be known next week. Nevertheless, what we know for sure is that the US Thanksgiving holiday implied Friday to be a light trading day and, as a result, low liquidity amplified market moves even further. As a matter of fact, Figure 16 illustrates the NYSE tick, which compares the number of stocks that are rising to these that are falling on the NYSE Index. As we can observe, this indicator showed the highest number of falling stocks since September 19th. At the same time, Friday’s trading session also witnessed the highest number of rising stocks since November 4th, something which reinforces my hypothesis of a foreseen market attack. Similarly, the Dark Index Indicator showed another divergence after the DIX leaped to “buy zone” on the same day the market was panicking from a threatening new Covid variant (Refer to Figure 17). Something which will give further evidence of whether what happened on Friday was “pure market manipulation” is the next week’s performance of the Russell 2000 Index, which is mainly formed by cyclical companies.


Implied vs. realized VIX reveal an increasing likelihood of a market correction
As we analysed in #06 and #08 Weekly Market Updates, VIX/VXV showed that the 3-month implied volatility being higher than the volatility for the next 30 days, suggesting that institutional investors do believe there will be a Christmas rally, and hence, lower volatility at least until end-of-year. This week, another divergence has been spotted. Before getting to the nitty gritty, we will first introduce the concepts of implied and realized volatility. Implied volatility represents the expected volatility of an asset over the life of the option and, as expectations change, option premiums react appropriately. The main drivers of this kind of volatility are the supply and demand of the underlying options as well as the market expectation of the share price’s direction. Options with high levels of implied volatility will result in high-priced option premiums. Realized or historical volatility is the assessment of variation in returns for an asset by analysing its historical returns within a defined time period. The realized volatility is caused by two components: a continuous volatility component and a jump component. Usually, realized and implied volatilities move in tandem, but, as today, they may occasionally separate. In Figure 18 we can appreciate how implied volatility is currently trading at a higher level than the 20-day realized volatility, something which did not occur since 2017 (ignoring the 2020’s Covid anomaly).

The meaning of this data is that institutional investors expect a spike in volatility in the next months, which may in turn translate into a market correction. Nevertheless, the drawdown may not necessarily take place in 2021 as a result of the favourable seasonality ahead. According to Morgan Stanley, a bull run may take place after a hypothetical insignificant correction, which may occur during the month December. It would be on the first two months of 2022 that a severe correction (>=25%) could originate. Other banks like Goldman Sachs remain bullish until 2022, when the Christmas effect would fade away and the market structure would then collapse leading to a market crash. But if there is something shared by all institutional investors, this is the cost of covering against fat tail risks or, said in other words, the cost of covering against three standard deviation events, the probability of occurrence of which equals 0.3%. Figure 19 shows the evolution of the cost of tail-risk protection. As we can observe, longer-term option prices reflect even more caution about the coming year. 12-month 25% out-of-the-money put options (which would only begin to pay off in a market crash that sends the S&P 500 below 3,500) now cost 2.4%, higher than at any point in September 2017.

Goldman Sachs has also analysed the rates markets, where volatility is approaching levels rarely seen in the last years. They conclude that both the rapidly rising interest rate implied volatility and the surmounting realized volatility in the bond market, which has been one of the highest in the last years, are being the main contributors to the high implied volatility in equities (Refer to Figure 20). According to them, US rates volatility is currently overvalued, something which would eventually drive interest rate volatility to stabilize and, as a result, the SPX volatility risk premium would follow suit.

Finally, Goldman Sachs has also identified that almost half of stock pairs of the top 50 constituents of the S&P 500 have had negative correlation with each other in November (Refer to Figure 21). This phenomenon seems to be related to the high single stock option volume because i) Buying single stock options instead of index options and ii) the non-fundamental stock trading generated by large option activity. This means that the present high implied correlation skew (put-side implied correlation being much higher than the call-side) suggests that a sell-off would be needed for stocks to re-correlate.

Disclaimer: I have done my best to ensure that the information provided on this newsletter is accurate and provide valuable information. Nevertheless, the content is used for illustrative purposes only and does not constitute investment advice.
Before you leave…
I kindly welcome your feedback/suggestions/critics, etc to improve the usefulness of it to you. You can reach me at jramos@u.nus.edu. If you would like to receive the newsletters as they are published please subscribe. I also appreciate if you share it with your friends who are interested in this space. Thank you.