

#12 Weekly market update (06/12/2021 - 10/12/2021)

Weekly performance:


Key takeaways:
Economic calendar. Chinese industrial production and retail sales will be the main macroeconomic data in Asia. The UK and Canada will release their CPI and PPI data, providing further evidence on inflation. Similarly, several countries in the Euro Zone will publish their CPI for November. Undoubtedly, the main macroeconomic events will take place on Wednesday and Thursday when the Fed and the BoE will announce their decision on the pace of tapering. Further evidence on interest rates will also be provided.
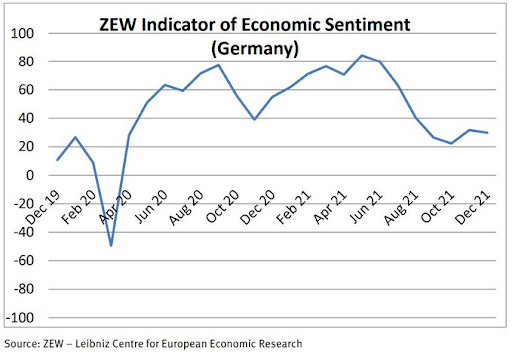
Macroeconomic outlook. US CPI hits +6.8% YoY, reaching a 39-year high. Deutsche Bank lifts optimism after suggesting Omicron is less lethal than Delta. German ZEW Indicator worsens after a brief recovery, suggesting unfavourable economic conditions. Dark Pool Index shows strong inflows as the SPX soars. The PBoC announced that it will lower the financial institutions’ reserve requirement ratio by 50 bps on December 15th to 8.4%. Michigan’s Consumer Sentiment Indicator slightly rebound from decade-lows in November. The Manheim Used Vehicle Value Index reaches a new all-time high at 232.5.
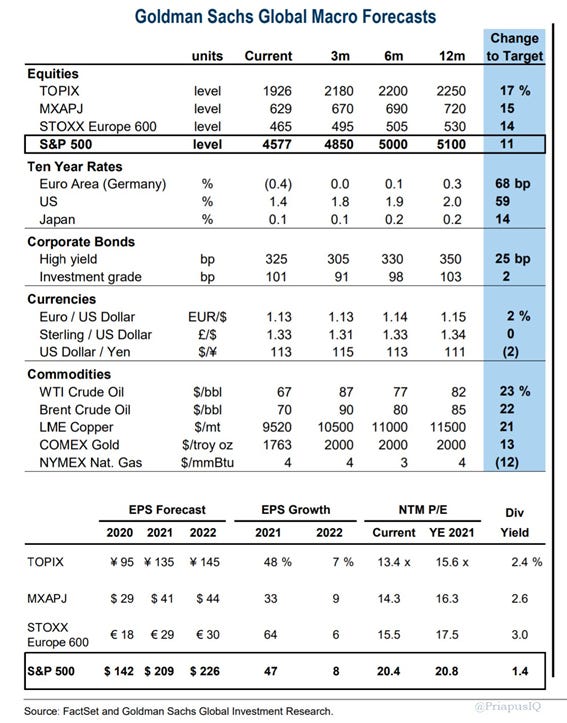
Equities. Positive gamma prevails unless the S&P 500 lost the $4,600 technical level. Goldman Sachs expects Asian Equities to outperform the S&P 500 in 2022. Corporate buybacks have reached a three-year high with $68bn in share repurchases YTD. Hedge Funds sold the highest amount of US Equities of the last twenty months. McElligott observes CTAs currently cumulate an aggregated net equity exposure of 2.8%, the lowest since 2011.
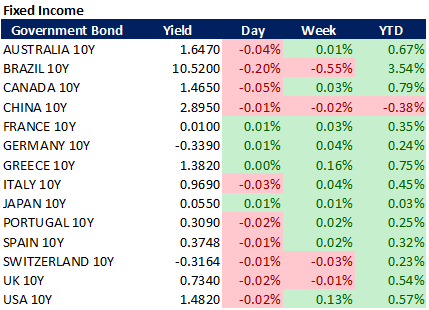
Fixed Income. The US yield curve resumes its flattening. US 10Y Real Yield reaches -5.33%, the lowest since the 1940s.
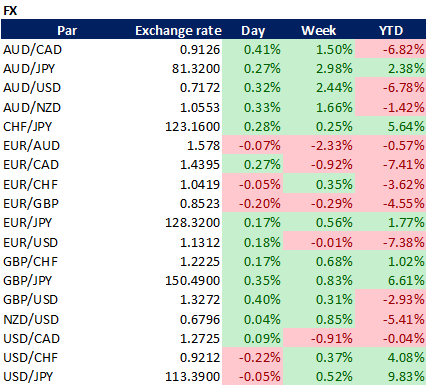
FX. The USD moderately rebounds against the EUR as inflation turns out to be lower than expected. The greenback appreciates 52 bps against the JPY, cumulating a gain of +9.83% YTD.
Emerging Markets. Fitch Ratings cuts Evergrande and Kaisa to “restricted default”, accounting for 15% of the outstanding dollar bonds sold by Chinese developers. CPC emphasizes technological development as the main economic goal for 2022.
Commodities. ING expects 2022 to be a profitable year for commodities. Goldman Sachs recommend overweighting Crude Oil and Copper in 2022, with forecasted returns of +23% and 21%, respectively. The increasing price of fertilizers poses Corn at risk given its high nitrogen requirement.
Markets extremely sensitive to Omicron coverage, Goldman and McElligott enlighten the uncertainty ahead
The trading week started with a strong rebound after early indications that hospitalisation and mortality rates from the Omicron variant are lower relative to the Delta variant surge. As analysed in #11 Weekly Market Update, Kolanovic from JPMorgan recommended buying the dip after formulating his hypothesis based on a paper from Gabriela Gomes, which concluded that when old variants propagate thus mutate into new variants these turn out to be more infectious but with a significantly lower mortality rate. On Monday, Deutsche Bank released a report in which they ran a regression model comparing omicron to other previous variants. In the scatterplot from Figure 1, we can observe how the Omicron variant has a significantly lower mortality rate than its precedent variants. European markets strongly rebounded on the first two trading days, regaining all the losses from the “Black Friday” (See Figures 2, 3, 4 & 5). EURO STOXX, DAX, CAC, IBEX despite the German ZEW Indicator of Economic Sentiment having deteriorated to 29.9 as a result of the latest developments in the COVID-19 pandemic. As we can observe in Figure 6, the Indicator worsened after a brief recovery and the reading suggests that the hopes for much stronger growth in the next six months are fading.


Except for the Russell 2000 Index, which still needs 2.82% to break even, the S&P 500 and NASDAQ Composite also recovered from the massive sell-off (Refer to Figures 7, 8 & 9). Another factor that substantiated the bullish momentum on Tuesday was Goldman Sachs’ release of its global macro forecasts for 2022. As we can observe in Figure 10, Goldman expects Asian Equities (TOPIX and MSCI Asia Ex-Japan) and European Equities (Euro Stoxx 600) to outperform the S&P 500, which is forecasted to soar 11% in the next 12 months. This view coincides with that of Michael Hartnett from BofA, which strongly recommends overweighting the EAFE Index. When it comes to fixed income, they expect the US 10Y Treasury yield to reach 2.00% by December 2022, something which according to empirical studies would dampen equities’ performance. With regards to FX, Goldman bets on an appreciation of the EUR against the USD, which cumulates a return of -5.53% YTD. We should bear in mind that seasonality goes against the greenback in December because of fiscal reasons (Refer to #11 Weekly Market Update for more details). Finally, when it comes to commodities, Crude Oil is their highest conviction trade with forecasts of +23% and +22% for the WTI and Brent, respectively. Copper comes as a close second with an appreciation of 21% as of December 2022. According to them, Gold should reach $2,000 per troy oz by March 2022, when it would remain flat until the end of the year. The Dutch bank ING expects 2022 to be “a profitable year” for commodities.


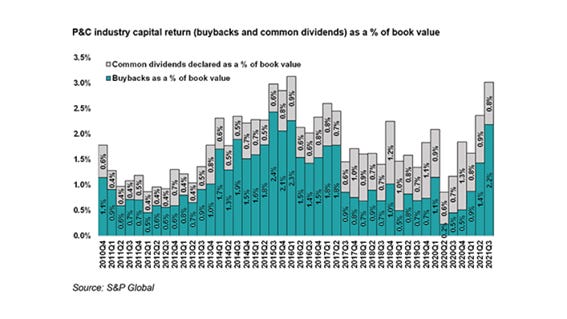
On the third trading session of the week, the range of the candle demonstrated that we had shifted to positive gamma again (would revert to negative gamma if SPX < $4,600). As a matter of fact, the last week was characterized by wide-ranged candles and large spikes in the $VIX Index. As analysed in #11 Weekly Market Update, the Dark Pool Index had been showing a buying divergence as the SPX plummeted. This week, the rebound has gone hand in hand with the DIX, which has also soared. As we can observe in Figure 11, the DIX is currently accompanying the S&P 500, which is usually a leading indicator of a “healthy” bullish momentum. This is also corroborated by the GEX, which has some way to go before reaching the “dangerous” level (See Figure 12). While the parties involved are still unknown, corporate buybacks have reached a three-year high with $68bn in share repurchases YTD (Refer to Figure 13). By region, Europe leads the ranking with $27.12bn, followed by Japan ($16.36bn) and the USA ($8bn). By sectors, as we can see in Figure 14, Healthcare (≈$24bn) has almost tripled the number of shares repurchased by the Finance industry (≈$9bn). Furthermore, if we compare the S&P 500 Buyback Index to the S&P 500, the former has outperformed the latter by 5% YTD (See Figure 15). S&P Global also observed that companies’ repurchases account for 2.2% of their book value, the highest since 2015 (Refer to Figure 16). Finally, the graph provided by “The Daily Shot” shows that 40% of the returns in the S&P 500 are a byproduct of corporate buybacks (See Figure 17).


But to understand the quantitative drivers of the markets, we must have a look at two sublime contributions. The first one, by Goldman Sachs, concluded that during the last two weeks, Hedge Funds sold the highest amount of US Equities of the last twenty months. Surprisingly, these sales were almost entirely driven by short sales. (Ratio of short sales to long sales = 9:1). The report outlined several striking findings. First, 7 of the 11 sectors were net sold with Info-Tech, Consumer Discretionary, Industrials and Utilities being the most shorted. The second one was a piece of art by Charlie McElligott, the MD of Cross-Asset Macro Strategy at Nomura. In his paper, he concluded that a short squeeze had been driving the market lately. When it comes to his CTA Trend Model, he observed that CTAs have not sold the S&P 500 yet (they would if it went below the $4,500 level), but they did significantly reduce its net long exposure to Global Equities by $94.5 bn in the last two weeks. Among these, we can identify indexes like the Russell 2000, Euro Stoxx, Nikkei 225, DAX, FTSE100, CAC40, Hang Seng, ASX, Kospi and Bovespa. Combined, CTAs currently cumulate an aggregated net equity exposure of 2.8%, the lowest since 2011 (Refer to Figure 18). Actually, Nomura’s Momentum Factor currently accounts for -7.3% in the last five trading days, which equals a -3.2 z-score move. To put things into perspective, this has been the largest one-week drawdown for the strategy since the week following the US Election (See Figure 19).


When it comes to the tangible risks ahead in the coming weeks, he considers the CTA’s sell triggers an important factor. If such a deleveraging takes place, a shift from +100% long to -40% short would take place, which would, in turn, lead to a possible market crash. Another important factor is volatility, which has made two new firsts: i) First time for a >30 close followed by a <20 close 3 days later; and ii) First time for a >30 intraday print followed by a <20 close 2 days later. (See Figure 20). A third component would have to do with the decreasing liquidity as well as the poor HF’s cumulative alpha as the end of the year approaches. Both conditions combined may be a “crashup” catalyst (Refer to Figures 21 & 22).


US CPI reaches 6.8%, jumping to a 39-year high
Undoubtedly, inflation has remained as the bone of contention this week, especially after Powell and Yellen admitted it not to be transitory. McElligott concluded his paper by stating that he does not expect the US inflation prints to peak until 1Q 2022, which brings about a higher probability of the Fed being forced to intervene while inflation remains at the forefront of political conversation – especially with the potentials that global authorities continue to respond to Covid seasonals with lockdown measures that will only exacerbate and extend these inflation pressures from the supply side. Said in other words, this means that if the data further accelerates and crystalizes the Fed’s hawkishness into more tightening needed, they will likely be powerless to intervene with the usual market jawboning to ease potential stress-points through the usual dovish guidance. Similarly, Bank of America released a paper forecasting November’s CPI to rise by 6.9% YoY (vs. 6.7% median consensus). Such a reading would imply the highest inflation of the last four decades. On that same paper, they also observed that the real earnings yield for the SPX hadn’t been this deep into negative territory since 1947. This has only happened 4 times before all of which resulted in bear markets (Refer to Figure 23).

On Thursday, Joe Biden advised that Friday’s US Inflation data would not reflect the recent drop in some prices including energy or, said in other words, he was already sending signals to the market about the reading of the next day which would be at least close to the abovementioned consensus. The US Initial Jobless Claims data was also released on that same date and showed the lowest unemployment since the 1960s (184,000 pax vs. 215,000 expected), providing further evidence to the strengthening labour force and the ongoing economic recovery (See Figure 24). Yet, this reading translates into an increased likelihood of the Fed becoming more hawkish. In a nutshell, Thursday’s trading session was moderately affected by both news and markets discounted the Fed would announce an acceleration of the tapering process on their next FOMC meeting which will take place on December 14-15th. Actually, after Biden’s commentary on Friday’s CPI data, both NASDAQ (tech) and Russell 2000 (cyclical) Indexes closed Thursday’s session with -1.31% and -2.20%, which implies that the market may have already priced the disastrous data released on Friday.

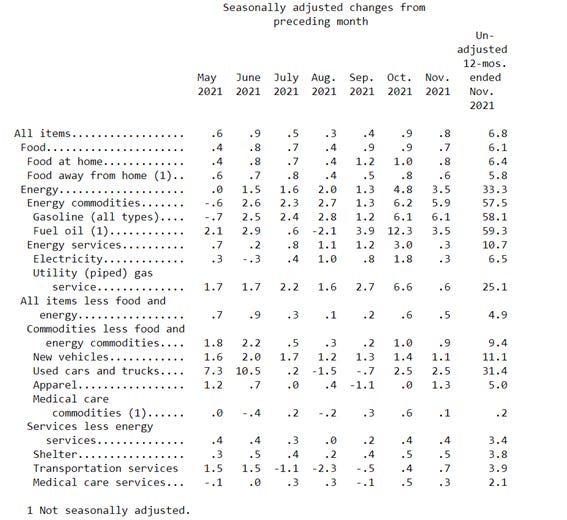
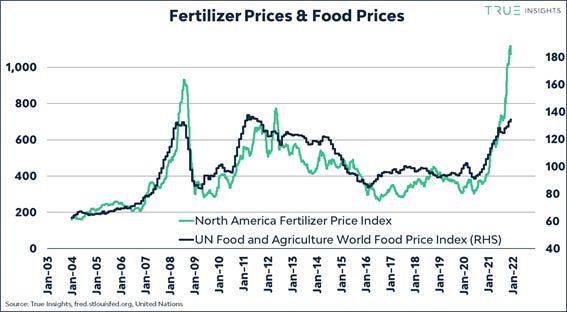
Figure 25 depicts the US CPI reading for November. As observed, the CPI increased 6.8% YoY – the highest since 1982 -, just between the forecast of Bank of America (6.9%) and the consensus (6.7%). The biggest contributor to the astonishing reading is the price of energy commodities, which cumulates a yearly increase of 57.5%. Yet, we must bear in mind that November was the worst month for Crude Oil since the beginning of the pandemic. As per the latest API Weekly Crude Oil Stocks data for the period ended on December 03, the inventories shrank 3.089M versus the previous depletion of 0.747M. Another factor that has driven inflation up is the increasing price of food, which has soared 6.1% YoY. Similarly, the price of fertilizers has gone vertical as the tightening of supplies and the increasing price of nitrogen are driving crop production costs upward, something which may impact the planted area in 2022 (See Figure 26). Undoubtedly, the main affected commodity would be corn, given its high fertilizer (which is made of nitrogen) requirement. As of this writing, global prices of nitrogen have surpassed the $1,000 per tonne level for the first time (vs. $110 July 2020). The factors driving the astonishing increase in prices of nitrogen are as follows. First, 60% of the fertilizer production was disrupted last winter by the arctic weather and in late summer by Hurricane Ida. Moreover, the soaring freight costs and the supply chain disruptions have brought about a decrease in output and consequently, exports. Some farmers have even resorted to the black market to secure fertilizer at exorbitant prices. Finally, these high prices may lead to delayed purchases which would, in turn, disrupt the expected production. As observed in Figure 27, ammonia prices have sharply increased due to high demand from Europe, where production continues to be constrained by high natural gas prices and paused production from U.S. Gulf nitrogen plants during the previous month. With regards to Urea, prices have significantly increased due to supply shortages concerns, as Russia and China recently announced measures to reduce their exports, plus ongoing high natural gas prices that are hindering European producers. If we exclude these two components, we obtain a Core CPI of +4.9% YoY.

Another significant factor that has been contributing to the abnormal inflation level is the price of used cars and trucks (+31.4% YoY). As we can observe in Figure 28, the Manheim Used Vehicle Value Index has reached a new all-time high at 232.5. With regards to the new and used vehicles sales, they have decreased 17% and 2% YoY, respectively.

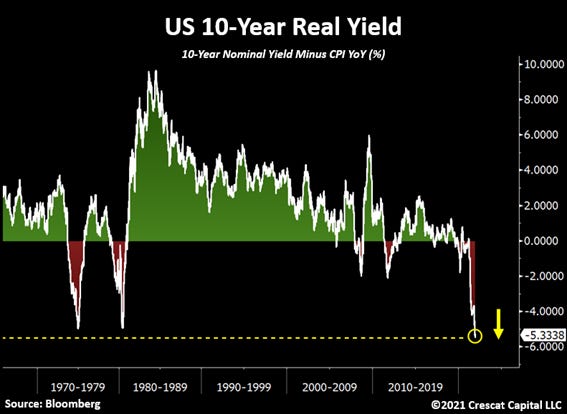
For these wondering how does the S&P 500 perform under high inflationary periods, Figure 29 depicts its performance against the US CPI since 1960. The author of the graph has also added a 5-year average of inflation to formulate his conclusion. As observed, every time that the CPI runs hot, the SPX nominal returns tend to be well-below average and real returns overall are negative. When it comes to fixed income, the yield curve has resumed its flattening and the US 10Y Real Yield has reached -5.33%, the lowest since the 1940s (See Figure 30).

One final observation about the core inflation levels is the great divergence between the United States and the Euro Area. As observed in Figure 31, the gap has exponentially increased during 2021. Undoubtedly, the $1.9 trillion American Rescue Plan (ARP) signed on March 11, 2021, has been one of the main triggers of the current abnormal inflation. Among others, the plan included direct stimulus payments of $1,400 to individuals, extended unemployment compensation, and the amount of the Child Tax Credit was increased while making it fully deductible. Overall, it provided $350 billion to state and local governments. The final vote of the ARP was 50-49 after all Republicans opposed. The rescue plan was entirely deficit-financed and, similarly, the Fed has been monetizing $80 billion per month of the federal government’s debt until October, when it announced the beginning of the tapering process. Before the decision was made, Lawrence Summers warned Democrats that the ARP would trigger hyperinflation. He also advised of the increasing discouragement to take new jobs if generous unemployment stimulus were deployed. Now that Powell has conceded inflation is not transitory, chances are the Fed will announce an acceleration of the tapering process at the next week’s FOMC meeting. Consequently, the first-rate hike is expected before Q2 2022.

Finally, the second important macroeconomic data released on Friday was the University of Michigan’s Consumer Sentiment Indicator, which has slightly rebounded from decade-lows in November. Figure 32 illustrates the Consumer Sentiment Index rising from 67.4 to 70.4 in the preliminary data for December. Surprisingly, the Expectations beat the forecast of 62.5 by 5.3, accounting for 67.8%, still a pessimistic reading. Similarly, the Buying Conditions modestly rebounded from multi-decade lows (See Figure 33). As for Inflation Expectations, both short- and mid-term UMich inflation expectations were unchanged in the preliminary December data at +3.0% and +4.9%, respectively (Refer to Figure 34). The highlight of the data was the huge gap represented in Figure 35 between the monthly gain among households with incomes in the lowest third of the income distribution (+23.6%) and that of the top third (-4.3%). The University of Michigan’s Chief Economist Richard Curtin stated that inflation was the biggest threat for all income, age, education, region, and political subgroups. (76% voted for inflation vs. 21% voted for unemployment)


China’s 2022 economic goals gravitate towards technological development. Chinese Developer Kaisa suspends trading again.
In previous Weekly Market Updates, we analysed the Common Prosperity campaign orchestrated by Xi Jinping to bring about a brighter outlook for the PRC. Some months after the announcement, the CPC decided to tackle the “disorderly expansion of capital” by implementing regulations on numerous sectors from tutoring to e-commerce to the internet & gaming. This move caused Chinese equities to plunge and negative sentiment towards Chinese markets soon spread out. As a result, emerging markets investors have witnessed the worst quarters in terms of returns since the early 2000s, something which has contributed to the MSCI World P/B ratio being consistently superior to that of the MSCI China during all the year. Hardly a week goes by without some news about Chinese stocks reaching a new 52-week low. Nevertheless, this negative sentiment towards China may reverse soon. On Monday, the PBoC announced that it will lower the financial institutions’ reserve requirement ratio by 50 bps on December 15th (weighted avg. down to ≈ 8.4%), which translates into a release of CNY 1.2 trillion ($188 bn) worth of long-term liquidity into the interbank system to boost the Chinese economy. Goldman Sachs admitted being surprised after the cut announcement given the PBoC preference for using OMO, MLF and structural tools such as lending programmes to provide liquidity as opposed to RRR cuts. They expect another RRR cut by Q1 2022. Moreover, Tuesday’s meeting of the Communist Party’s Politburo left some surprises. After 52 weeks of persistent Chinese tech crackdown, the CPC emphasized technological development as the main economic goal for 2022. Said in other words, China will commit to speeding up the implementation of technology policies, tackling key technologies and improving supply chain resilience. To everyone’s surprise, monopolistic, antitrust or cybersecurity practices were not mentioned during the meeting, something which suggests that a change of narrative may take place soon. Despite the MSCI China Index is currently trading at the lowest against its global peers since 2006, the Chinese major Indexes have closed a fruitful week (Refer to Figures 36).

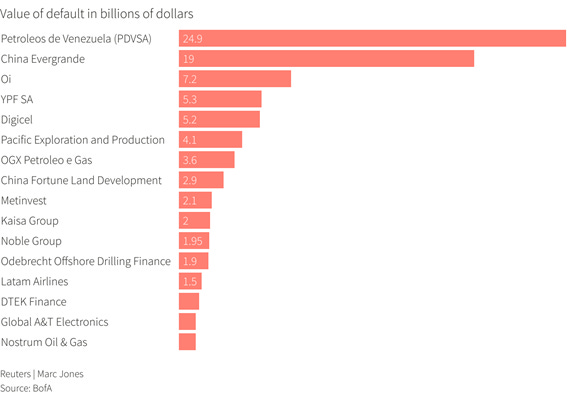
With regards to the contagion effect initiated by the Chinese developer Evergrande, Kaisa halted trading in the Hang Seng amid increasing concerns about its ability to commit to its debt repayment after failing to repay some of its overseas creditors. According to Bloomberg News, Kaisa failed to repay $400 million in overdue coupon payments the company owed by the end of Tuesday – when a 30-day grace period ran out – remained unpaid (Refer to Figure 37). On Thursday, Fitch Ratings cut Evergrande and Kaisa to “restricted default”. As of this writing, the world’s most indebted real estate developer failed to make two coupon payments by the end of its grace period worth $19.2 billion (Refer to Figure 38). Combined, they account for 15% of the outstanding dollar bonds sold by Chinese developers. JPMorgan has recently counted a total of 11 defaults YTD, and it expects more to come as land sales are currently slumping over 55% YoY, and housing sales are down 25% in October. The default of Evergrande is the second biggest ever in EM according to Reuters (See Figure 39). The ball is now on the CPC’s court to handle the biggest restructuring that has ever taken place in China. In my opinion, the Chinese government will undoubtedly step in, but they will prioritize social stability & employment and I expect them to bail in offshore credit, when necessary, given the real estate sector accounts for 25% of their GDP and 75% of the wealth of the household. If we compare the underlying holdings between Kaisa and Evergrande we can easily notice that Kaisa is focused on urban redevelopment projects, which implies its properties are much more liquid than Evergrande’s, which mainly owns defaulted theme-parks in Tier 3 cities. Thus, Evergrande’s properties valuation is way less liquid and uncertain than these of the former. I for me, the key issue is knowing how will the CPC deal with the fact that the developers have issued their bonds via some offshore entity, something which could be a stress test for the Chinese legal system.


Disclaimer: I have done my best to ensure that the information provided on this newsletter is accurate and provide valuable information. Nevertheless, the content is used for illustrative purposes only and does not constitute investment advice.
Before you leave…
I kindly welcome your feedback/suggestions/critics, etc to improve the usefulness of it to you. You can reach me at jramos@u.nus.edu. If you would like to receive the newsletters as they are published please subscribe. I also appreciate if you share it with your friends who are interested in this space. Thank you.