

#14 Weekly market update (20/12/2021 - 24/12/2021)

Weekly performance:


Key takeaways:
Economic calendar. Next week is expected to be light when it comes to economic data. Russia will report its Manufacturing PMI, the CPI as well as Retail sales. In APAC, China will publish its Manufacturing PMI while Japan will release the CPI, retail sales and Industrial Production. In Europe, Spain’s CPI will be the highlight of the week. When it comes to LATAM, all eyes will be on Brazil’s Gross debt-to-GDP ratio. Finally, the most relevant economic data in the US will be energy-related as EIA refinery crude runs, distillate fuel production, gasoline production and Crude oil inventories are expected to be published.
Macroeconomic outlook. Spanish PPI reading shows a new all-time at +33.1%. US PCE hits nearly a four-decade high, casting doubts on Fed’s 2022 forecasts. Manheim Used Vehicle Value Index reaches a new all-time high at 239.8, cumulating a 48.9% YoY increase. CB and UMich’s Consumer Sentiment Indexes show a rising optimism about economic conditions and higher expected income gains during 2022.
Equities. Strong consensus about this year’s Christmas rally. The renowned quantitative analyst from Nomura, Charlie McElligott, observes constructive bets by institutional investors and expects a decline in implied volatility, which combined would bring about a virtuous circle for equities. CTAs remain all-in long in QQQ, SPX, Euro Stoxx; short in DAX and ASX. BofA identifies massive inflow from corporates and retail investors, reinforcing their hypothesis of buybacks and FOMO being the main drivers of the equities’ performance. Ryan Detrick analyses January’s SPX performance in the years without Christmas rally, findings show poor returns when this occurs.
Fixed Income. Strong auction for US 20Y bonds highlights the crucial role of US Treasuries in the current financial markets. US Treasuries close the trading week in red, significantly affected by the PCE data.
FX. The Turkish Lira significantly appreciates against the USD after Erdogan announces a new scheme to prevent speculators from attacking the currency. The Euro appreciates 200 bps against the JPY as the latter deactivates its safe-haven role.
Emerging Markets. Some Chinese local governments begin accelerating the construction of infrastructure projects from the 2020-2025 infrastructure plan. The “Big 3” credit rating agencies update the Chinese developers’ scores. Almost nine out of ten wealthy Chinese expect to at least maintain their spending on luxury watches in the following year.
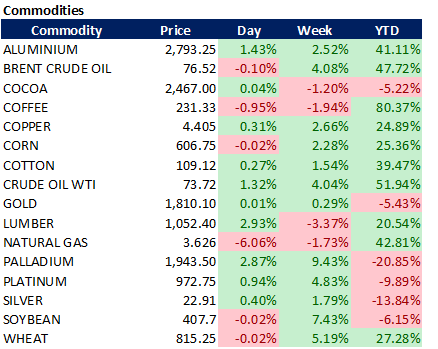
Commodities. Russian gas flows at the Mallnow entry drop to zero as the flows are reversed from west to east. Dutch Natural gas futures whip back after soaring to a record high. US LNG export terminals witness the highest demand in history (13.1bn cubic feet), implying all 6 US exports facilities to be currently operating at or above capacity. Inventories of crude oil are at their lowest since 2017.
Some macroeconomic data has been released throughout the week…
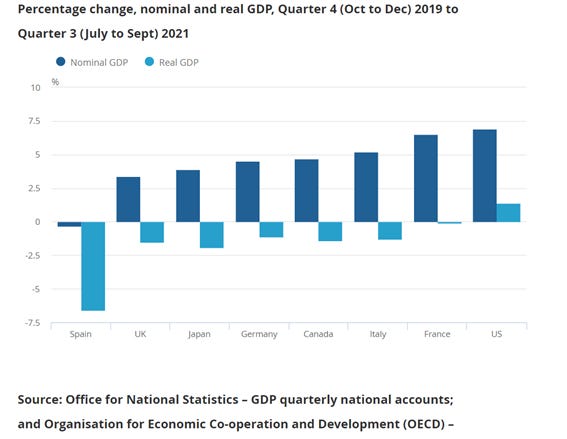
On Wednesday, the Office for National Statistics released the UK’s GDP growth. Accounting for +1.1% QoQ, the British economy is now 1.5% below pre-Covid levels (Refer to Figure 1). According to estimates, the Annual UK GDP in 2020 has fallen 9.4%. The biggest contributors in Q3 were the hospitality, arts, entertainment and recreation sectors as restrictions progressively eased and the economy re-opened again. On the other hand, the production and construction sectors decreased QoQ. Compared to other world major economies, the UK is significantly growing at a slower pace (See Figure 2). Nevertheless, Spain is currently one of the worst-performing economies, with a negative nominal growth rate. But if something is damaging the Spanish economy, this is inflation. Unlike other countries, Spain cumulates an abnormal increase in PPI with the latest reading showing a new all-time high at +33.1% YoY (Refer to Figure 3). As analysed in #06 Weekly Market Update, a generalized increase in PPI has two possible outcomes: Either producers absorb the higher manufacturing costs, something which would then take its toll on their future earnings, or, on the other hand, producers opt for passing these costs to consumers, which would then negatively affect to CPI and ultimately skyrocket, triggering a domino effect. On top of that, we must consider the current unfavourable macroeconomic scenario where the Spanish business textile has not fully recovered from the economic shutdown forced by the pandemic.


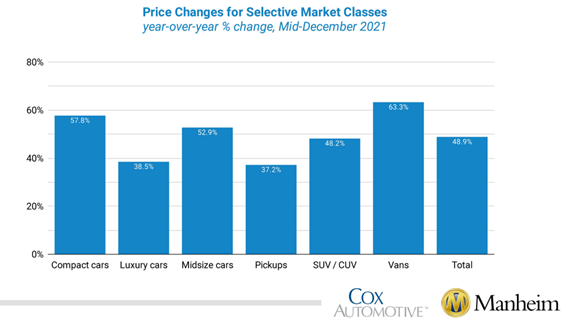
The category of used cars and trucks, one of the biggest contributors to inflation, is still far from reaching its peak after the Manheim Used Vehicle Value Index showed a new all-time high reading at 239.8 (Refer to Figure 4). As we can appreciate in Figure 5, the price of second-hand vehicles has soared 48.9% YoY, with both Vans and compact cars’ segments outpacing the overall industry. Another takeaway from Manheim’s report is the worsening auto loan performance, which has deteriorated throughout 2021 as government support and loan facilities eased. Compared to November 2020, >60-day delinquencies have increased 5.2%, showing a reversion to the mean.

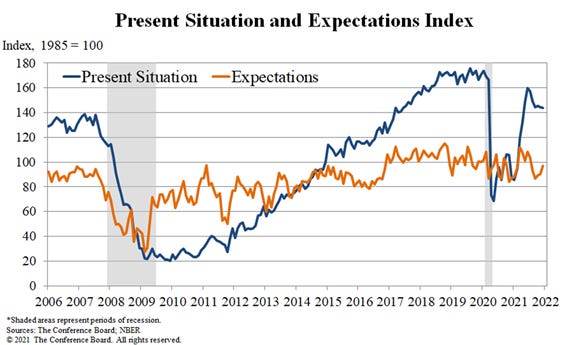
With regards to the US, the main macroeconomic data have been the Conference Board and University of Michigan’s consumer confidence Indexes as well as the PCE. Both the CB and the UMich indexes have shown better than expected readings. Figure 6 corresponds to the December’s Conference Board Consumer Confidence Index, which now stands at 115.8 (vs. 111.9 prev.). As we can observe in Figure 7, the main contributor to the Index improvement was the better outlook in Expectations, which rose from 90.2 to 96.9. As for the Present Situation, it remained flat at 144.1 (prev. 144.4). Overall, the Index suggests the economy has maintained its momentum in December and expectations for the incoming year seem favourable. Similarly, the percentage of respondents planning to purchase homes, automobiles, major appliances and vacations over the next six months all increased. When it comes to the University of Michigan’s Consumer Sentiment Index, it beat the consensus of 70.4 by 0.2, showing a rising optimism about economic conditions and higher expected income gains during 2022(See Figure 8). Given the data was collected before the worsening situation of the Omicron variant, January will likely show lower consumer confidence levels. Something on which both Indexes coincided is the worsening situation due to inflationary pressures. This fear for the persistent price increases was reflected in the PCE, which is now the highest since 1982 (Refer to Figure 9). The Fed’s favourite inflation gauge showed a reading of +5.7% YoY (Core PCE = +4.7% YoY), suggesting inflation is still unlikely to slow down anytime soon. Nevertheless, the Fed forecasts expect inflation to be around 2.6% by December 2022, an excessively optimistic forecast in my humble opinion. Finally, the data used for the December computations do not include Omicron’s updates, whomst impact on inflation is still unknown.


… but investors have everything ready for Santa’s visit
The negative sentiment after the last option expiry date of 2021 persisted on Monday when most of the world major indexes ended the trading session with significant losses. As analysed in #13 Weekly Market Update, McElligott released more market reports than usual defending a Christmas rally expected to last between 2 and 4 weeks, with most of the trading volume taking place the week after Christmas. It is worth bearing in mind that this trading week has been shorter than usual because of all markets being closed on Friday (because of Christmas being on Saturday this year), except for Asian markets, which have operated as usual. As observed in Figures 10 & 11, the two US leading indexes, S&P 500 and NASDAQ have rebounded in the 100-MA, initiating a consistent rebound which has led to positive returns day in day out. Were these indexes to consolidate over $4,600 and $15,900, respectively, would contribute to stabilizing US markets, especially the former, where positive gamma reactivates. The main challenge for the SPX will be breaking the technical resistance at $4,700, where it cumulates numerous unsuccessful attempts. As we can observe in Figure 12, almost 4 out of every 5 NYSE, AMEX and NASDAQ stocks advanced on Tuesday’s session, something unusual on an average trading session. This sentiment was also captured by Figure 13, which shows a generalized increase of the broad market.


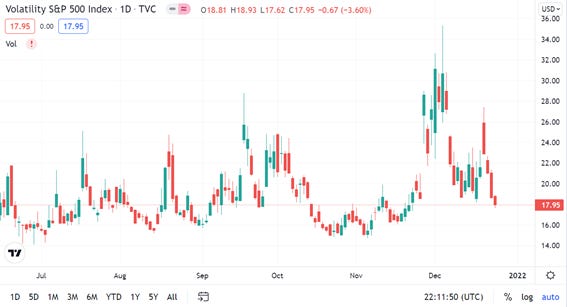
In order to further understand the market structure I always thoroughly read several reports published by several leading quantitative analysts from diverse institutions. This week, McElligott has released a new market update. In his paper, he identified an anomaly with regards to the US equities’ volatility. As the leading indexes reached the session lows, a substantial amount of put sales & put spreads were closed on tickers that had been hard hit during the last weeks (e.g. $ARKK, $KWEB). Similarly, numerous calls & call spreads were bought on $KRE and $XBI, among others. Said in other words, this phenomenon would translate into an unedging trade, which McElligott labels as “constructive and even offensive”. Moreover, he identified these constructive bets in the decrease of the implied VIX (Refer to Figure 14) as well as in the CBOE Skew Index. Thus, he expects a substantial increase in “mechanical demand” for equities, foreseeing a steady decrease in the VIX Index which will, in turn, incentivize a higher monetization of hedges and volatility sales, creating a buying Delta, which will ultimately feed into a virtuous cycle for equities. From a technical analysis point of view, in order to find a reliable entry point for the hypothetical Christmas rally, we would have to wait for candles to narrow (similar to these during the last half of October) so as institutional investors started selling volatility and positive gamma prevailed, bringing about an increasing bullish momentum. Finally, McElligott concludes his report by analysing the CTAs positioning. As observed in Figure 15, the selling point in the SPX has significantly changed. In order to interpret this image, we must first understand the figures. The first column refers to the CTAs latest position; the fifth corresponds to the level as of the date the report was written; the sixth is the level at which they would close their short positions (if applies); the seventh refers to the level at which they would close their long positions (if applies). Thus, according to this infography, the CTAs are currently 100% long on the SPX, and they would sell at $4,323.19, which unsurprisingly equals the MA200. Similarly, they remain 100% long on QQQ, and they would sell at $14,928.6, slightly below the MA200. In general, they have not modified their positioning compared to last week (third column). Nevertheless, the main turnaround has been in the German DAX, which has gone from all-in to 33% short.

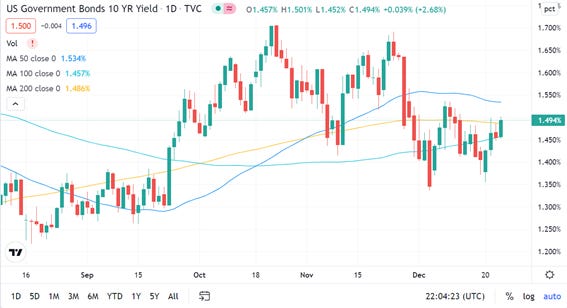
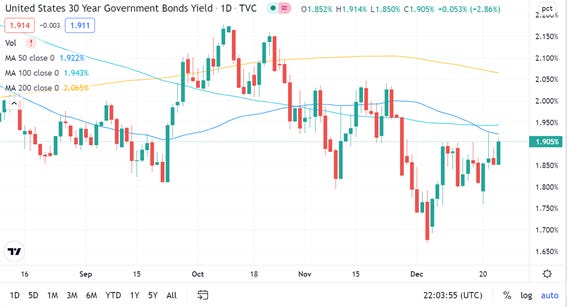
The bonds market had a negative session as US yields soared amid optimistic economic conditions despite the worsening situation with the Omicron variant. Tuesday’s US 20-year bond auction showed strong demand ($20bn) with direct bidders accounting for 20.8% of the total, the highest since last year, highlighting the crucial role of US Treasuries in the present financial markets, especially at a time when many other nations’ debt pays little or no interest. Similarly, US Treasuries ended the week in red after the release of the PCE data, which reminded investors inflation is here to stay (See Figures 16 & 17).
BofA also made a comparison of the net buys of its clients between two weeks ago and the last month’s average. As we can observe in Figure 18, all clients had been buying equities with corporate and retail investors leading the rank. This data reinforces the hypothesis analysed in prior Weekly Market Updates, of the corporate buybacks and retail investors’ FOMO to be a significant driver of the equities’ performance.

According to empirical studies by Yale Hirsch, the creator of the Stock Trader’s Almanac, the rally comprises the last five trading days of the year and the first two of the following one. Hence, 2021’s rally is expected to initiate on Monday, December 27th. Statistically speaking, the odds of the S&P 500 closing higher on the last trading days are higher than 50% (See Figure 19). But what if Santa does not show up? Ryan Detrick, Chief Market Strategist at LPL Financial has studied the years in which the Christmas rally did not materialize. The first thing we observe when referring to Figure 20 is that the rally has taken place every single year except for six occasions since 1990. In five out of the six years, January SPX returns were, at least lower than -2.5%. This negative sentiment persisted during the following year with only two of the six years yielding positive returns. Surprisingly, Santa showed up in neither 1999 nor 2007 and the S&P 500 plummeted 10.5% and 38.5%, respectively in the subsequent years.


Winter has come and the energy crisis is here to stay
Economically speaking, energy markets are by definition, price-inelastic and hence, volatile. Since April 2020, when the WTI Crude Oil futures went negative and LNG prices hit record lows as a consequence of low energy demand, the path of energy investors has been a bumpy ride. As all major world economies are going through an energy supply shortage and the persisting global trade disruptions from the pandemic, collateral damages to the broad economy are being irreversible. This short-term crisis has revealed the strong dependency of European gas markets on imports, something which combined with the tough EU’s cap-and-trade programme on carbon dioxide emissions, has brought about gas and power prices setting new records each day as companies rush to cover the portion of gas demand not covered by long-term contracts on the very tight spot market. Russia, the main supplier of natural gas to Europe is currently providing a limited amount due to field maintenance, low domestic storage and ultimately, geopolitics. Since mid-December, the Russian gas flows at the Mallnow entry were below 50 gigawatt-hours a day (Refer to Figure 21). Yet, on Tuesday they have dropped to zero as the flows were going east from Germany into Poland. Consequently, the futures’ prices of the Dutch Natural gas soared to a record high, pricing the German wind output deficit, and ultimately worsening the energy crisis. Nevertheless, Dutch TTF plummeted on Thursday below €140. (See Figure 22). On Thursday, some sources claimed that China and Russia had reached an oil-gold agreement, which stipulates that oil sold by Russia to China shall be settled in RMB. Meanwhile, Russia can use the RMB obtained to purchase RMB-denominated gold at the Shanghai Gold Exchange or the Shanghai Futures Exchange. Curiously, Russia set up a gold office in Beijing to handle this business more than 6 years ago. Through this deal, both parties have skipped the USD to conduct oil renminbi transactions, with gold playing the role of guaranty. Furthermore, coincidence or not, China’s gold imports are strongly rebounding on 2021 with November being the month with 60 tonnes of gold imported, the highest in the last 22 months (Refer to Figure 23).


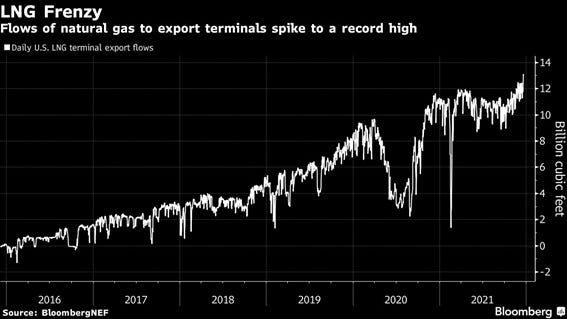
With regards to the US natural gas futures, they initiated a sharp rally as a result of the European gas futures increase and whipped back on Thursday after the Dutch future correction. Hitting a record 13.1bn cubic feet, US LNG export terminals have witnessed the highest demand in history (See Figure 24). As of this writing, all 6 US export facilities are operating at or above capacity.
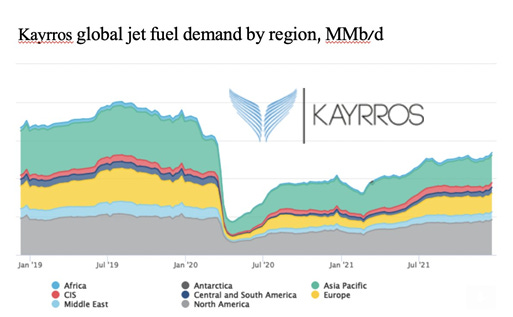
As for crude oil, despite last month futures’ poor performance, the WTI Crude oil future has rebounded on the MA200 and is now attacking the resistance of the MA100 (See Figure 25). Moreover, the inventories of black gold are currently at their lowest since 2017 (Refer to Figure 26). Moreover, the global jet fuel demand has been steadily increasing over the last three quarters of 2021 (See Figure 27).


The meltdown of the Turkish Lira cools down after Erdogan’s intervention
Having already cumulated a 55% depreciation against the USD YTD, the Turkish Lira significantly appreciated after the Turkish President, Recep Tayyip Erdogan, announced a new scheme in order to prevent speculators from attacking the TRY. We must bear in mind that the macroeconomic environment is unfavourable for the Lira as numerous rate cuts have been mandated over the last months so as to cope with high and increasing inflation. Moreover, the hawkishness of the Fed has brought about EM currencies to significantly underperform throughout this year (Refer to Figure 28). All this combined has led Turkish citizens to start converting their savings into USD, EUR or gold.

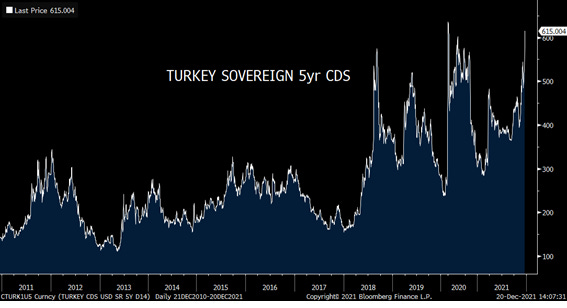
In order to fix this problem, Erdogan announced a new investment tool, which has been labelled as “Turkish dollar” by some on social media. The functioning of this enacted solution is simple: As an investor, you would need to convert your foreign currency into TRY and deposit your converted amount in a savings account with a certain term of maturity (3/6/9/12M). The crucial point in this approach is the commitment by Turkey’s treasury to guarantee an equal return as that of FX markets. Were these FX markets to drop below the official interest rates, the investor would be reimbursed with all the mark-to-market losses. One of the conditions to benefit from the scheme is to comply with the stipulated maturity or, on the contrary, a conversion to a lower forex rate would be applied. On that same day, the TRY had its biggest daily rally since 1983 with the greenback depreciating by almost 30% against the Lira. According to the Union of Turkish Banks, more than $1bn was converted into TRY after Erdogan’s announcement. Nevertheless, several economists and FX strategists soon criticised the move as the proposed mechanism would ultimately lead to an increased public deficit (shift from the Turkish private sector to the government balance sheet). Additionally, this investment tool should be considered an implicit rate hike as the Treasury will in effect foot the bill of the difference with inflation. In order to understand the sentence above let’s apply some basic numbers: Suppose the FX rate increases 50% and the interest rate is 20%. The differential (30%) will have to be paid by Treasury, which ultimately would have the same impact as an interest rate hike. The scenario would worsen if the new tool pushed inflation higher, which would require more TRY to be injected into the markets. This negative sentiment towards the new scheme was priced in 5-year Turkey’s CDS which showed the worst second reading of the last decade at 615 (Refer to Figure 29), and, as observed in Figure 30, the cost of insuring Turkey’s debt against default is now higher than insuring that of Iraq. As My take on this issue is that chances are this tool gets out of control, which would trigger a currency crisis as the Central Bank would be forced to offset the additional losses by printing more TRY. Actually, this situation has striking similarities with that of the 1970s, when Turkey implemented the “Convertible Turkish Lira Deposits (CTLD)”, to prevent its currency from further devaluation. The outcome demolished the Turkish economy which faced a huge credit explosion by local banks, a hyperinflationary period and an additional $2.5bn in new public debt. As of this writing, the USD/TRY sits at 11.36921 (Refer to Figure 31). Only time will tell whether this approach is enough to deter attacks from speculators and restore momentum.


2022 may be the year of the Chinese economic recovery; indebted Chinese developers remain in the spotlight
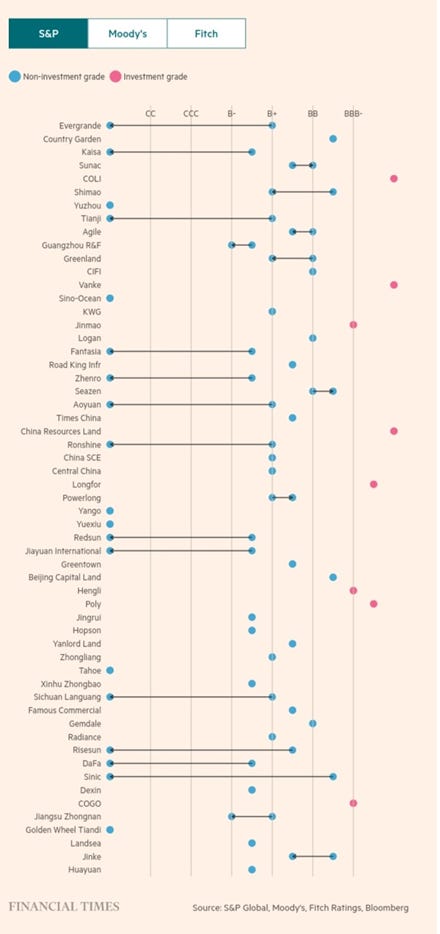
After the PBoC announced China’s fiscal policy shift from contractive to expansive in 2022, all eyes are on the indebted real estate developers and their future performance. Among many other promised measures to stabilise growth, infrastructure spending is expected to rebound in 2022. Furthermore, new tax and fee-reduction policies will be implemented. As a result, many experts show worrying concerns about the possibility of a property sector’s hard landing, something which could dampen China’s economic growth. Last week, China’s finance ministry announced that local governments were offered RMB 1.46 trillion ($229bn) in quotas for 2022 special-purpose bonds to foster investment and support the economy. This plan had already failed in prior years due to the local governments’ reluctance to make use of this quota despite their growing financial difficulties (61% of the quota taken up). The Ministry of Finance also stated that infrastructure investments should be promoted by local governments. Were they motivated to do so, chances are infrastructure investment would lag behind. To fix this issue, the Ministry of Finance together with the state’s economic planner, coordinated the so-called “National Development and Reform Commission (NDRC)”, which aims at urging local governments to make use of the special-purpose bonds since the second half of the year. Some local governments have already taken measures and begun accelerating the construction of infrastructure projects from the 2020-2025 infrastructure plan. For instance, Shenzhen has committed to speeding up its plan to upgrade and construct new 5G networks, satellite communications, and computing power facilities. In a recent article by the Financial Times, the newspaper warned of China’s huge debt burden, which as of 2020 accounted for 272% of GDP after a strong stimulus to counter the fallout from the coronavirus pandemic. Moreover, they also provided three different charts with the Chinese developers’ latest ratings by S&P, Moody’s and Fitch credit agencies (Refer to Figures 32, 33 & 34).


Financial Times has also observed a recent trend among Chinese investors which has accentuated after the real estate implosion. In order to substantiate their hypothesis, the London-based newspaper has resorted to market research groups and polls. In an October survey of 1,500 Chinese adults with more than RMB 500,000 ($78,480) in annual household income, 88% of the respondents expected to at least maintain their spending (RMB 76,700) on luxury watches in the following year. Some of these also claimed that it’s under inflationary periods (like now) when investing in luxury watches becomes fruitful given the watches’ hedging role. Additionally, unlike real estate, luxury watches are more liquid and easier to sell. Similarly, portability is a major trait of high-end watches as it allows the owner to transfer assets abroad if needed. An interviewee stated: “Customs officials either won’t notice your watch or may not know how much it is worth. This creates a safe and efficient way to take your money abroad”. According to Watcheco, China’s leading online platform for second-hand timepieces, most of the high-end brands’ models have cumulated an increase of as much as five times their original price as a result of the massive demand and the lack of supply.
Disclaimer: I have done my best to ensure that the information provided in this newsletter is accurate and provide valuable information. Nevertheless, the content is used for illustrative purposes only and does not constitute investment advice.
Before you leave…
I kindly welcome your feedback/suggestions/critics, etc to improve its usefulness to you. You can reach me at jramos@u.nus.edu. If you would like to receive the newsletters as they are published please subscribe. I also appreciate it if you share it with your friends who are interested in this space. Thank you.