

#15 Weekly market update (27/12/2021 - 31/12/2021)

Weekly performance:


Key takeaways:
Economic calendar. Several countries of the Eurozone report their manufacturing PMIs, which will reflect the latest market conditions. Inflation, probably one of the key issues in 2022, will be further assessed after countries like South Korea, Switzerland, France, Italy, and Germany will publish their CPI. In the bonds market, the Japanese and Spanish 10Y auctions may leave some interesting findings. Undoubtedly, one of the highlights of the week will be the OPEC meeting, which will take place on Tuesday.
Macroeconomic outlook. Spanish CPI hits 6.7%, the highest since 1989. Elon Musk expects the next crash to take place at some point in Spring or Summer 2022. According to the Dow Jones 4 Year Election Cycle, 2022 will be the least profitable year of the Biden mandate. South Korea’s Industrial production hits a 17-month high and boosts optimism on supply chain disruptions.
Equities. Despite Goldman Sachs expects the Christmas rally to continue in January, the S&P 500 has a call wall on the $4,800 level. Only three hedge funds have beaten the S&P 500 in 2021, which has yielded a return of 27%. Two-thirds of the NASDAQ components are currently trading below its 200MA. Consumer staples and Real Estate have been the most profitable sectors of December.
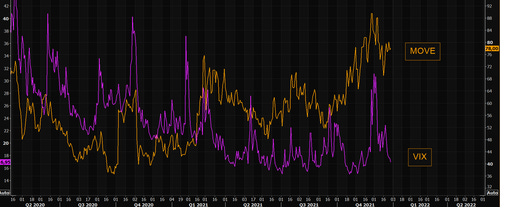
Fixed Income. The US yield curves resume their flattening and the 10Y bond closes the year at 1.5118%, just below its 50MA. The huge divergence between the MOVE and VIX Indexes reflects the worst outlook priced by bonds. CoT shorts are at their highest since February 2020.
FX. 2021 has been the most favourable year for the USD since 2015, with an appreciation of 7.08% against the EUR. Hedge funds and CoT are the most bullish on the USD since June and October 2019, respectively.
Emerging Markets. China is projected to grow 5.1% in 2022, the CPC’s target may be between 5.5% and 6%. The PBoC assists the indebted developers in their asset selling process to financially healthier companies. Twelve Chinese cities may face potential municipal fiscal unsustainability given their strong dependence on land taxes. The contrarian sentiment may trigger a rebound of the Chinese tech stocks.
Commodities. WTI Crude Oil has yielded a return of 55.30% in 2021, the highest in the last 12 years. Gold ends the year with -3.74%, failing to accomplish its inflation hedging role.
Massive call wall at 480 may cap the Christmas rally
With a yearly return of 27%, the S&P 500 has closed the trading year at $4,766.12 and has managed to keep afloat in a year in which the Fed has doubled the velocity of the tapering, admitted inflation not to be transitory, and new Covid variants having hit the headlines day in day out. According to Bloomberg, only three hedge funds have beaten the leading Index throughout 2021 (Refer to Figure 1). Now, the SPX is in the middle of a Christmas rally, which was accurately predicted by quantitative analysts. Nevertheless, this year’s last trading session did not reach a new high, as is usually the case in the years in which a Christmas rally takes place. Moreover, several indicators are showing a high probability of the S&P 500 getting stuck on the 4,800-4,850 level. It was on Wednesday when the S&P 500 started to fight tooth and nail against that level. The icing on the cake was one Elon Musk’s tweet predicting the next crash to take place at some point in Spring or Summer 2022. Only time will tell whether he is right. To date, from a technical point of view, the $4,800 level seems highly unlikely to be broken given several reasons (See Figure 2).


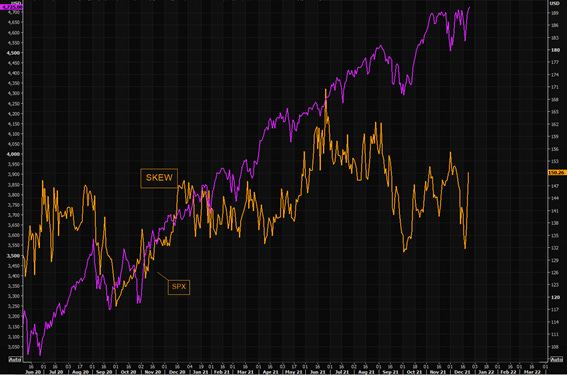
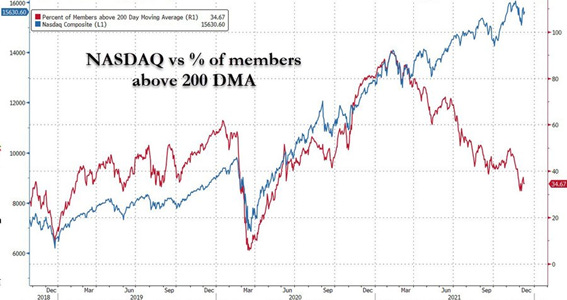
First, there has been a significant decrease in the institutional investors’ buying volume. As we can observe in Figure 3, the DIX has reached a 3-month low, signalling selling volume. This trend may have been deducted from the performance of the SKEW Index. Derived from the prices of OTM options, the SKEW Index measures perceived tail-risk in the S&P 500 or, said in other words, events whose probability of occurrence equals 0.3%. According to empirical studies, a typical range in the SKEW Index is anywhere between 100 and 150. As observed in Figure 4, it now sits slightly over 150, suggesting institutional investors may be hedging their portfolios for the incoming year. At this level, the estimated probability of 30-day S&P 500 returns to be 2 and 3 standard deviations below the mean equal 15.9% and 3.1%, respectively. As a rule of thumb, each five-point move in the SKEW Index adds or subtracts about 1.3 or 1.4 percentage points to the risk of a two standard deviation move. A five-point move adds or subtracts approximately 0.3 percentage points to a three-standard deviation move. At the same time, this tail-risk protection may have been accentuated by the huge divergence inside the US major indexes. Despite having reached new all-time highs, the reality is that most of its components have experienced substantial drawdowns. Figure 5 shows the % of NASDAQ stocks trading above its 200MA. As observed, two-thirds of its constituents are currently signalling a bearish trend, something which utterly differs from the NASDAQ performance. As a matter of fact, by excluding the FAANG stocks to the NASDAQ Composite, the performance of the Index in 2021 would have been significantly negative (Refer to Figure 6). Similarly, by comparing the S&P 500 with the world major indexes, we can see that only 4 out of every 10 indexes are trading over its 50MA (See Figure 7). JP Morgan has released a paper studying this topic and has identified some interesting findings. When it comes to the equities’ current market concentration, the biggest 50 stocks account for 56% of the SPX (61% in 2000 and 65% in 1972-1973) as a result of negative real yields in the bond market, forcing investors to look for alternative secure, liquid and profitable options. From their findings, we can see that huge concentration is not a synonym of market correction/crash as only in 2 of the 7 preceding occasions did the market slump. Nevertheless, Figure 8 shows the excessive valuations comparing seven different metrics.


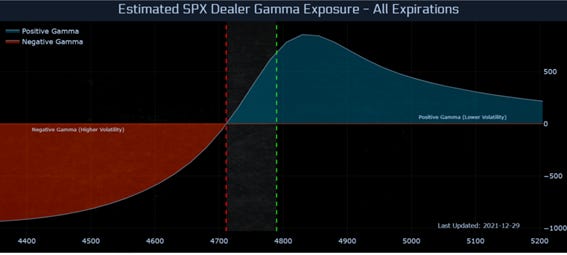
The second factor has to do with quantitative analysis. This week, Spotgamma has identified abnormal gamma levels. As we can appreciate in Figure 9, the 480 level cumulates absolute gamma accounting for 600 million. Additionally, Figure 10 shows the flip dealer point which currently sits at $4,800. More precisely, $4,850 represents the peak, and from that level onwards, positive gamma gradually fades. Conversely, negative gamma would reactivate if the SPX fell below $4,700.

Goldman believes the Christmas rally to continue in January
Despite the facts abovementioned challenging the Christmas rally, Goldman Sachs published its weekly Trade Flow paper forecasting the rally to continue in January. Based on the hypothesis that institutional investors have been playing safe and that retail investors’ FOMO has been the main driver of the recent market upside, they claim Santa may not head towards the North Pole until the end of January. As for the institutionals’ portfolio rebalancing, they only expect -$26,000 million equities’ sales. Furthermore, as systematic and retail investors are being driven by FOMO, institutional investors should follow suit. As a matter of fact, equities registered their biggest inflow in the last 3 months, a movement that has been financed by the bearish bond sentiment. Figure 11 shows the net shorts in US 10Y bonds, which is at their highest since February 2020. Similarly, investors remain net short in US 30Y bonds (See Figure 12). Another trait that may differentiate January is the preference for high beta stocks. As stated previously, this year has been characterized by a bunch of stocks pushing the major indexes upwards while most of its other constituents have been hammered. As we can observe in Figure 13, the drawdown of the Index compared to that of the average stock is substantially different. Take the S&P 500 as an example: While the index has only witnessed a drawdown of 3.1%, the average stock has lost 13% of its value. The same applies to all other US major indexes namely Nasdaq or Russell. For this reason, this may be a great opportunity to initiate some positions in high-beta stocks as money will soon fly from low-beta stocks, which are starting to show clear overheating signals. Some trades worth researching would be i) Value/Cyclicals; ii) E-commerce, gaming, biotech, payments and/or cybersecurity. Moreover, seasonality would favour the trade as January is historically the month with the highest yield for high-beta stocks.


Spanish CPI hits 6.7%, the highest since 1989
Last week, Spain released its December’s PPI data, which reached a new all-time high at +33.1% YoY. This week, Spain has once again hit the headlines after publishing the country’s CPI. Sitting at +6.7% YoY (+5.5% prev.), inflation is now at the highest since 1989 (See Figure 14). Undoubtedly, this abnormal inflation is the by-product of the skyrocketing energy and fertilizer prices. This is evidenced by analysing Core CPI, which excludes the price of food and energy. As observed in Figure 15, Core CPI accounts for +2.1% YoY, proving energy prices are the main contributors to the high inflation level. As analysed in prior Weekly Market Updates, the Spanish business textile will suffer irreversible damage from this hyperinflation and Spanish citizens will ultimately be affected as businesses will have no choice but to pass some of their increased costs. As of today, chances are inflation will need several months before reaching its peak, something which casts serious doubts on the major central banks’ forecasts on inflation for the incoming year.


South Korea’s Industrial production hits a 17-month high and boosts optimism on supply chain disruptions
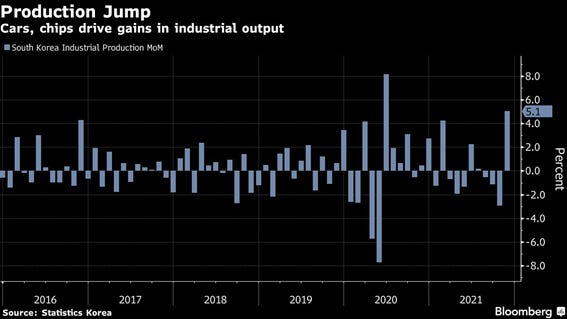
One of the most unexpected positive news was Thursday’s South Korea factory production, which jumped to its highest since mid-2020, suggesting supply disruptions that hurt manufacturing in key industries may be easing. Accounting for +5.1% YoY, the Industrial Production has brought to an end three months of declines and beaten economists’ estimates of +2.5% YoY (Refer to Figure 16). The main takeaway has been the recovery of automobile production, which has soared 11.3%. Similarly, semiconductor manufacturing has increased by 4.5%. Nevertheless, South Korea’s Finance Minister stated that despite November gains in output fully recovered the losses in the last three months and contributed to the fastest increase in facilities investment since 2014, we cannot be complacent over this data as the global spread of the Omicron variant, inflation and the persistent supply disruptions may take some time to cool down.
China is expected to grow 5.1% in 2022
Contrary to the Western, where Christmas holidays have paralyzed news’ flow, this has been a busy week for the Chinese economy. Immersed in a property market crisis and strict Covid-19 measures in order to guarantee the Winter Olympics in Beijing, China has demonstrated a strong preference for stable management of the economy. The CPC communicated they were considering setting the 2022 growth target in the 5.5% to 6% range. In a survey of 33 economists, the average projected growth rate for 2022 is 5.1%, with the range being between 4% and 5.9% (Refer to Figure 17). To put things into perspective, the IMF forecasted in October that the Chinese economy would expand 5.6% in 2022. This week the PBoC has also announced that it will help struggling developers in the selling process of assets to financially healthier companies, especially SOEs, given their high credit ratings and their ability to raise capital at low-interest rates. Yet, purchases of nonperforming assets bundled with higher-quality assets will not be covered. To help buyers secure the funding, the PBoC will push banks to provide financing and underwrite bond floats. But if there is something that is worrying for the Chinese economy is the strong dependence of some of its regions on land taxes. As observed in Figure 18, twelve cities (Wenzhou; Kunming; Fuzhou; Hangzhou; Taiyuan; Hefei; Wuhan; Xian; Guangzhou; Nanjing; Foshan; Zhengzhou) generated more than 100% of its 2019 fiscal budget from these taxes. Acknowledging Evergrande’s collapse, there is no doubt that these cities face potential municipal fiscal unsustainability. Cities like Beijing and Shanghai remain healthy with 29% and 28% of their fiscal budget being generated from land taxes. With regards to Chinese markets, the NASDAQ Golden Dragon China Index, which tracks Chinese technology stocks, reported a gain of almost 10% on Thursday. As Figure 19 points out, shorting Chinese stocks may have become too mainstream that the contrarian sentiment may favour a rebound of most of these hammered stocks.


“Never bet against America”
The increasing divergence in the velocity of the rate hikes between the USA and the EU is leading to a strengthening of the USD, which has had the most profitable year since 2015 and has appreciated 7.08% against the Euro. This week, the ECB has stated that no interest rate hikes will take place before 2023, when the remaining bond purchases are expected to conclude (Refer to #13 Weekly Market Update for the detailed ECB’s Asset Purchase Programme timeline). After the Fed officially doubled the velocity of the tapering to $30bn a month and left the door open to 3 interest rate hikes, the market immediately reacted and as observed in Figure 20, as of December 23rd, there was a probability of 76% for three hikes to take place in 2022 (95% for two). It comes as no surprise then that the greenback being one of the most favoured trades. One of my favourite macro analysts and former Head of a $20bn portfolio, Alfonso Peccatiello, recommends going long on USD Cash. Moreover, hedge funds are extremely bullish on the USD, a level not seen since June 2019 (See Figure 21). With regards to the CoT, their net longs on the greenback are the highest since October 2019 (Refer to Figure 22). WTI Crude Oil has also been a winning trade in 2021, with a yearly return of 55.30%, the highest in the last 12 years. Despite Goldman Sachs releasing a report expecting the black gold to reach $100 per barrel by 2023 based on too low a supply to keep up with record demand, the momentum seems to be fading for CoTs, whose net long positions have reached a 15-week low (See Figure 23).


What can we expect from 2022?
Undoubtedly, these last two years have been utterly disrupted by the Covid-19 pandemic, which has forced many businesses to reinvent their business models in order to make ends meet. Others like e-commerce or remote working software providers have benefited from these tailwinds. Almost two years later, the latest variant (Omicron) is proving to be less severe than its precedents with lower hospitalization and mortality rates. It comes as no surprise then that many investment banks have redone their predictions. From the markets’ point of view, the end of the pandemic may be closer than expected, but economically speaking, the bond markets are discounting a pessimistic outlook for 2022. As observed in Figure 24, the US yield curves have been flattening anticipating a policy mistake by the Fed. Nevertheless, Friday’s unprofitable trading session for technology brought about a decrease in bonds and the US 10Y closed the year at 1.5118%, just below its 50MA. The negative sentiment towards bonds has been a combination of factors such as increasing negative real rates but if there is something that has taken its toll during the last year, this is the lack of retail investors. As of today, this category represents 38% of the total trading volume, which means that they are no longer a minority group. As we analysed in #14 Weekly Market Updates, corporate buybacks and retail investors’ FOMO have been the main drivers of the US major indexes performance. This divergence can be observable through the VIX and MOVE indexes, as the latter significantly contradicts the former (See Figure 25). Another unfavourable statistic for the next year is the well-known Dow Jones 4 Year Election Cycle. The so-called 4-year election cycle phenomenon differentiates not by political party, but by the year of the presidency. From 1900 to 2020, the Dow Jones Industrial Average (DJIA) on average gained 5.9% in presidential election years. In pre-election years, it did even better, posting a gain of 9.0%. By contrast, in post-election years it rose just 4.5%, and in the subsequent midterm election years just 1.4%. As observed in Figure 26, we are heading towards the least profitable term of the cycle which combined with the present (2021) year, would yield a 5% return. According to Seasonax, the weak returns in the two years after the election are driven by monetary and fiscal policy. Given the president wants to be re-elected or at least, wants their successor to be a member of their party, they try to stimulate the economy before the election in order to generate positive sentiment among voters. Typically, most of these measures are financed by deficit spending. Additionally, loose fiscal policies tend to provide a boost to financial markets.


Disclaimer: I have done my best to ensure that the information provided in this newsletter is accurate and provide valuable information. Nevertheless, the content is used for illustrative purposes only and does not constitute investment advice.
Before you leave…
I kindly welcome your feedback/suggestions/critics, etc to improve its usefulness to you. You can reach me at jramos@u.nus.edu. If you would like to receive the newsletters as they are published please subscribe. I also appreciate it if you share it with your friends who are interested in this space. Thank you.