

#16 Weekly market update (03/01/2022 - 07/01/2022)

Weekly performance:


Key takeaways:
Economic calendar. Australia will report its building approvals, trade balance as well as Retail sales. When it comes to LATAM, all eyes will be on Brazil’s CPI. In Europe, Christine Lagarde is expected to speak on Tuesday. Finally, the most relevant economic data in the US will be the testification of Jerome Powell on Tuesday, the release of the CPI and the 10-year auction. In Asia, China will publish its CPI and its trade balance.
Macroeconomic outlook. Germany’s CPI soars at the fastest pace in the last three decades. The Fed leaves the door open for a quantitative tightening, admits increasing inflation may bring about a sooner-than-expected first rate hike. December’s Manufacturing ISM suggests global supply pressures remain high but may have begun to moderate. US hourly average earnings increase 0.6% MoM and revive wage-price spiral fears. The ISM’s non-manufacturing business survey unveils the impact of the Omicron variant on the US economy.
Equities. NASDAQ has outperformed ARKK ETF by almost 20% since the beginning of the pandemic. Almost 40% of the NASDAQ stocks have gone through a drawdown of 50% from their respective 52-week highs while NASDAQ being so close to highs, something it did not occur since 1999. Investors rotate from growth to value
Fixed Income. Treasuries register their worst start since 2009. Yield curves resume their flattening, discounting a policy mistake. Hedge funds’ net shorts on US 30Y Treasuries reach a 5-week low.
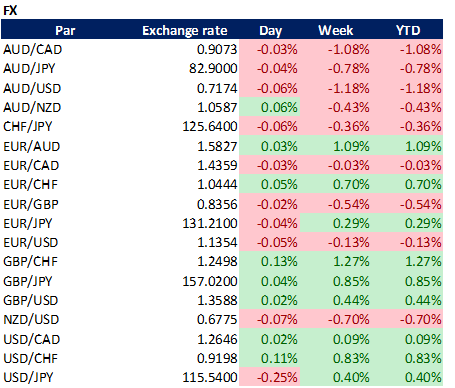
FX. The Japanese yen currently trades (in real terms) at its lowest of the last 50 years.
Emerging Markets. China’s central bank issues E-CNY app. Evergrande suspends trading after the local government of Danzhou orders the demolition of 39 buildings. Relative valuation of Asian equities against its global peers at its lowest in the last 18 years.
Commodities. Energy sector skyrockets after a new political upheaval in Kazakhstan.
Treasuries register their worst start to the year since 2009. A hawkish Fed warns of a possible balance sheet reduction and triggers a massive sell-off in unprofitable tech stocks.
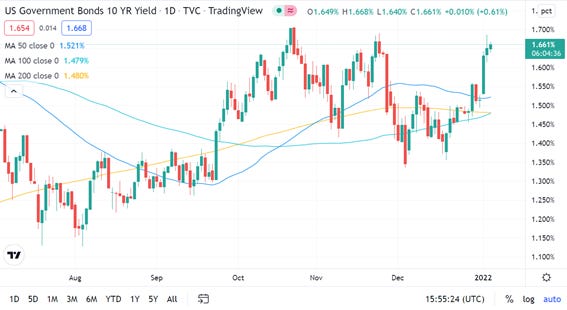
Monday was both the first trading session of 2022 and the last official day of the Christmas rally. On that same day, some important markets like London were closed so it was not until Tuesday that some signals started to appear. Goldman Sachs had already warned some weeks ago of the excessive concentration by the FAANG. As a matter of fact, AAPL, MSFT, NVDA, TSLA, GOOGL had contributed to 51% of the S&P 500 returns since April. Something unexpected during this week has been the exponential increase in US Treasury yields, which have seen their biggest increase since March 2020. Charlie McElligott from Nomura soon published a report stating that the recent spike in yields had been caused by liquidity-driven trades as bearish bets were re-engaged. As we can observe in Figure 1, the US10Y Yields had already broken the 50MA, something which translated into having even ground to a clean uprise. Conversely, the US30Y Yields had a stronger resistance on their 200MA, which contributed to a minor spike (Refer to Figure 2). But which are the assumptions that traders are taking into account when placing these bets? The first assumption consists of threatening hyperinflation, which has contributed to the supply chains of most industries being disrupted. McElligott identified an abnormal premium spent on 71k of the TYH2 127 Puts (~1.95% yield target by mid-Feb exp) at nearly ~$5.5mm bp dv01. By analysing the 10-year breakeven rates, we can observe that investors are expecting the Omicron variant to increase inflationary pressures in the US economy. Hence, it comes as no surprise that these rates are currently sitting at 2.66% (2.36% as of mid-Dec). The next two assumptions are related to economic growth and employment, which both send positive signals with the Atlanta Fed GDPNow and unemployment rate at 7.641% and 4.2%, respectively. Finally, the last assumption has to do with Tapering. As analysed in previous Weekly Market Updates, not only I expected the Fed to accelerate the tapering process but also to hike rates multiple times throughout 2022. As of this writing, this is the consensus, and some investors are speculating that the Fed may hike more than 25bps at a time. All of these combined brought about a “Long-Term Momentum Shock” to equities, which experienced the largest drawdown in the factor since the peak of the meme stock/hedge fund unwind in late January 2021. As a result, the trade consisted of going long on value, large-cap, cyclical stocks while selling tech. This was easily appreciated by comparing the Dow Jones Index to the NASDAQ (See Figure 3). Another clear rotation initiated as a result of the soar in the US Treasury yields was the large inflow in undervalued companies. As we can appreciate in Figure 4, 20% of the Russell 1000 components with the lowest EPS registered an average increase of 2%, while the 10% of those with the highest EPS plummeted by almost 3%.


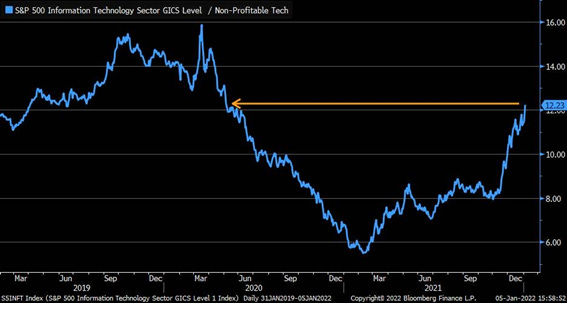
But the biggest surprise came on Wednesday, when the S&P500, NASDAQ and Russell 2000 plummeted after the European markets closed (Refer to Figure 5). The catalyser for this abrupt change was the hawkish attitude during the FOMC Meeting, which left two main takeaways: First, the Fed officials acknowledged inflation to be significantly high, something which leaves the room open for the first rate hike to take place sooner than what markets were pricing by then. Consequently, traders’ bets on the Fed rate hikes throughout 2022 have significantly changed since last month, now pricing an 80% probability of a rate hike by March (Refer to Figure 6). The second one was a “hit and sunk” for financial markets. The Wall Street Journal had warned that the Fed may initiate a balance sheet reduction, deploying another tool to tighten policy amid increasing inflation. On the previous meeting, the Fed officials committed to accelerating the pace of the Tapering process to end in March, when interest rates would then be probably hiked. The underlying assumption of the announced Tapering implies the Fed reinvesting the proceeds of maturing securities into new ones, which economically speaking, has a neutral effect. Nevertheless, a shrinkage in its balance sheet would translate into a decrease in its holdings as they would allow its bonds to mature. From the financial markets’ point of view, this is a piece of bearish news given the strong correlation between the Fed’s balance sheet and the S&P 500, especially after the massive liquidity deployed post-Covid (See Figure 7). Soon after the meeting, some investment banks published their forecasts on the hypothetical balance sheet reduction. JPMorgan, one of the most optimistic, believes the Fed will initiate the quantitative adjustment by September with a cap at $100,000 million per month, a reduction that would be two times faster than that of the 2017-2019 period. Conversely, Goldman Sachs expects the balance sheet shrinkage to initiate soon. In any case, past performance provides us with a clear message: Every time the Fed has initiated a balance sheet reduction, the S&P 500 has been immersed into a bearish trend. In the best-case scenarios, the SPX has remained lateral for months, even years. As the new macroeconomic environment unfolded, investors initiated a massive sell-off in unprofitable tech stocks (Refer to Figure 8). Similarly, the major US indexes (S&P 500, NASDAQ and Russell 2000) closed Wednesday’s trading session with losses exceeding 1%, the benchmark defined by Charlie McElligott in order to predict spikes in volatility (See Figures 9, 10 & 11). The Nomura’s renowned strategist remained optimistic unless the S&P 500 cumulated several trading sessions with variations of ±1.00%, something which could trigger market turbulence. In order to better illustrate the tech sell-off, I have analysed the performance of the ARKK ETF, which is characterized by holding stocks “whose product or service can potentially change the way the world works”. As of this writing, Cathy Wood’s fund is suffering the worst drawdown since inception (-44% from the top). To put things into perspective, the sell-off in March 2020 brought about ARKK plummet by 42% (See Figure 12). Compared to the QQQ performance, Figure 13 shows how the NASDAQ has outperformed ARKK by almost 20% since the beginning of the pandemic. As analysed in #15 Weekly Market Update, two-thirds of the NASDAQ constituents were currently trading below its 200MA, signalling a bearish trend, compared to the NASDAQ performance. Sentiment Trader has published another striking finding (Refer to Figure 14), in which they outline the divergence between the index and its components’ performance. As observed, almost 40% of the stocks have gone through a drawdown of 50% from their respective 52-week highs while NASDAQ being so close to highs, something it did not occur since 1999. Conversely, one of the biggest winners from the weakness in the bonds market is the financial sector, which has reached a new all-time high, given the improvement in their P&L when yields rise (Refer to Figure 15). Yet, this may end up being counterproductive to their fixed income portfolios, which would keep deteriorating if yields keep soaring.


My take on the situation has not changed since early December, when the yield curve was flattening at the fastest pace since March 2020. Since I posted my views on the #11 Weekly Market Update, the US 10-30 Yield Curve has further flattened (Refer to Figure 16). Recall that according to the economic theory, under “normal” circumstances, when US 10Y Treasuries fall X%, US 30Y Treasuries should respond by decreasing 3X%. In a nutshell, fixed income traders are currently pricing their distrust on the Fed. Their message to the market is that the Fed will make a policy mistake if they hike rates as they would be forced to lower them later. Before the FOMC meeting, hedge funds’ short positions in US 30Y Treasuries were the lowest in the last five weeks (See Figure 17). What investors are currently trying to predict is the SPX level at which the Fed will be forced to admit its policy mistake, something which has been exaggerated after them leaving the door open to a quantitative tightening (QT). Acknowledging that the Fed’s balance sheet has doubled during the pandemic, keeping it stable would require a significant reinvestment which would be way higher than that during pre-covid. By playing with simple numbers, the Fed would need to buy (reinvest) $400,000 million in Treasuries with coupons on Q2 and Q3 2022 in order to keep its balance sheet stable. Of these $400,000 million, 59% were bought during the pandemic. For this reason, such a strategy may absorb the impact of the projected rate hikes amid high inflation. Bank of America has already done these calculations and they believe the Fed will permit $10,000 million in Treasuries to exit its balance sheet during the first month of the QT (which they forecast to take place in October 2022). This pace would be accelerated to $40,000 million per month by January 2023 onwards. Overall, they expect the QT to bring about a balance sheet of $4,7bn, which would translate into a net gain of 15% with respect to pre-Covid (See Figure 18). As of today, by having a look at the Dark Pool Index, institutional investors’ selling volume remains progressively decreasing and starts approaching a danger zone, something which makes me think of a possible dead cat bounce (Refer to Figure 19). In my opinion, I believe SPX’s 200MA is highly likely to be the benchmark for the Fed. Below $4,390- $4,400, some of the Fed officials may start positioning against the consensus. Overall, my investment recommendation keeps being long in USD, duration (+20Y treasuries), and value. Similarly, as analysed in #15 Weekly Market Update, the contrarian sentiment may trigger massive inflows in most of the hammered Chinese stocks. Nevertheless, it is worth bearing in mind that the macroeconomic outlook suggests underweighting Chinese equities.


December’s Manufacturing ISM suggests global supply pressures remain high but may have begun to moderate.
December’s Manufacturing ISM Survey data was published on Tuesday and, despite showing a worse-than-expected reading, there have been some hidden clues. Before analysing the results, we will first introduce why is it important and how is it computed. The Institute for Supply Management (ISM) does two monthly surveys: Whereas the first is based on comments from purchasing managers in the manufacturing sector, the second deals with their counterparts in the non-manufacturing, or service, industry. The manufacturing ISM Survey consists of questionnaires mailed to about 400 US companies, representing 20 different industries. These corporate purchasing managers are asked to assess whether the activity is rising, falling or unchanged in the following fields detailed in Figure 20:

Once the responses are compiled, they are equally weighted as follows: New orders (20%); Production (20%); Employment (20%); Supplier deliveries (20%); and Inventories (20%). The remaining components only provide additional coverage on the evolution of the manufacturing activity. In order to compute the final value, ISM takes the percentage of those who reported activity being higher in each component and adds that to half the percentage of those who reported seeing no changes. A reading over 50 translates into a growing manufacturing sector. Conversely, if this value is less than 50, it would mean that the manufacturing sector is contracting. As observed in Figure 21, December’s reading has ended below 60 (58.7 vs. 61.1 prev.). Despite decreasing 2.4% MoM, the indicator is still indicating expansion in the overall economy for the 19th month in a row. As we can appreciate in Figure 22, the five weighting components have moderately decreased, except for employment, which has soared 0.9% MoM. Nevertheless, commodity prices have undoubtedly been the silver lining of the December data. With a decrease of 14.2% MoM, 4 out of every 10 companies has paid higher prices for raw materials. Despite this number may seem to be considered high, it represents a significant decrease from November, when almost 7 of every 10 companies reported having paid a higher price. Hence, there may be some light at the end of the tunnel suggesting product scarcity may be starting to ease, something which would ultimately contribute to lower inflation. It is worth bearing in mind that despite last week’s South Korea Industrial Production suggested similar findings, we are still at an early stage to determine whether the global supply chain pressures will end up soon.


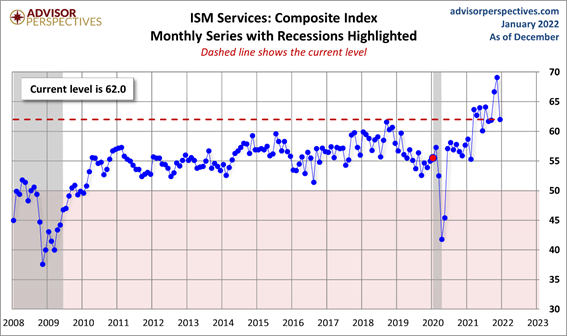
The ISM’s non-manufacturing business survey was also published during the week and demonstrated the Omicron variant is taking its toll on the global economy. Before analysing December’s data, I will briefly introduce this indicator and its usefulness in financial markets. To put things into perspective, the service sector represents more than 85% of the entire US economy. One of the main drawbacks of this survey is the fact that it is not as cyclical as the manufacturing one. During tough economic times, Americans quickly slash spending on pricey manufactured goods (e.g. cars, furniture, etc.), but they will not significantly pare back outlays on services, because there is always a demand for medical care, transportation and communications. Nevertheless, it encompasses so much of the economy and provides a very current assessment of the business conditions. There are some similarities and differences between this survey and the manufacturing. Both look at the same components, such as the backlog of orders, new orders, employment, new export orders, imports, prices, inventory sentiment, supplier deliveries, and inventories. However, since we are dealing essentially with services, these categories are defined somewhat different. For instance, exports in the non-manufacturing sector are not about shipping goods to other countries; they are about selling financial, consulting, entertainment, and accounting services to foreign companies and individuals. The non-manufacturing business survey consists of questionnaires mailed to more than 370 US companies in over 17 industries, including legal services, entertainment, real estate, communications, insurance, transportation, banking, etc. The proportion of companies queried in each industry depends on how much that sector contributes to GDP. Respondents are asked if they are experiencing higher activity, lower activity, or no change as follows (Refer to Figure 23):

Once the responses are compiled, they are equally weighted as follows: Business activity (25%); New orders (25%); Employment (25%); and Supplier deliveries (25%). The remaining components only provide additional coverage on the evolution of the services sector’s activity. A reading equal to 50 shows that the same percentage of purchasing managers reported higher activity as lower activity. When the index exceeds 50, it indicates growth. Conversely, when the index falls below 50, it means contraction. As observed in Figure 24, December’s reading has significantly contracted MoM (63.90 vs. 74.6 prev.). Moreover, by analysing each of the components, we can easily see that three of the four weighting components have sharply contracted by at least 7% (See Figure 25), suggesting the US economy is being hard-hit by the Omicron variant.

Inflation: The biggest threat to markets in 2022
Germany’s CPI data was released on Thursday showing an increase of 5.3% YoY, the fastest in almost 30 years (Refer to Figure 26). According to the German Federal Statistics Office, the acceleration has been intensified by the higher energy costs, supply chains disruptions and a temporary VAT cut introduced in December 2020 to mitigate the impact of Covid, which lowers the base against which current price rises are measured. We must bear in mind that the Bundesbank raised its 2022 inflation forecast to 3.6% from 1.8% last June. Even the current predictions for 2023 and 2024 (2.2% for both years) exceed the ECB inflation target of 2%. Joerg Kraemer, an analyst from Commerzbank stated that while inflation should fall by the end of 2022 due to special factors, inflation risks are pointing upwards, not only for Germany but also for the Eurozone. These risks were confirmed on Friday after the ECB released the CPI for the Eurozone. The inflation of the 19 countries sharing the Euro soared 5% YoY (+4.9% prev.), beating analysts’ consensus of +4.7%, reaching a new all-time high for the block (See Figure 27). Unsurprisingly, the biggest contributor was the price of energy, which soared 26% YoY (Refer to Figure 28). Yet, by analysing Core CPI, we can realize it is still over the 2% target, something which reinforces the consensus among central banks - including the U.S. Federal Reserve (Fed) – that inflation may prove more persistent than once thought. It is worth bearing in mind that the ECB has stuck with its narrative that price growth will slip back below the target on its own in late 2022. This rising inflation has taken its toll on European investors’ confidence, which now sits on the lowest since 2011. Conversely, the Euro Stoxx 50, which is currently trading at its highest since 2008, seems not to be pricing this lack of confidence (See Figure 29). In the US, fears of a wage-price spiral increased after December’s average hourly earnings (Refer to Figure 30). Despite the YoY trend having fallen below 5%, the monthly variation on the MoM basis has significantly soared (+0.6% vs. +0.4% prev.). Finally, another event that has affected the price of commodities has been the political destabilization of Kazakhstan, the second most important ally of Russia. On Sunday, numerous residents of Zhanaozen, an oil town in western Kazakhstan, took to the streets to protest high prices for liquefied petroleum gas. This protest wave soon spread across the entire country and thousands of people joined. Unfortunately, energy problems are not something new for the country. Last year, Kazakhstan failed to generate sufficient electricity, leading to an emergency shutdown, and had to rely on Russia to compensate for the power outages. As a consequence, investors have been pouring capital into the commodity ETF, and the energy sector has been the most profitable during this week with an increase of more than 10% (Refer to Figure 31).


China’s central bank-issued digital currency (“E-CNY”) app is now available for download
With the Beijing Winter Olympics taking place in less than one month, Chinese authorities have released the trial version of the digital yuan app, whose download was previously restricted via private links. While only residents are qualified to register, not all Chinese will be entitled to its download as the pilot regions include Shenzhen; Suzhou; Xiong’an; Chengdu; Shanghai; Hainan; Changsha; Xi’an; Qingdao; Dalian and Winter Olympics scenes (including Beijing and Zhangjiakou). Nevertheless, Winter Olympics’ foreign visitors without a Chinese bank account will also have access to the digital yuan. As of November, about 140 million Chinese residents had opened a digital yuan account, with accumulated transactions reaching CNY 62bn ($9.7bn). To put things into perspective, Alipay, which is the main payment service reported 1.3 billion users as of June 2020 and cumulated CNY 118 trillion in payments.
Disclaimer: I have done my best to ensure that the information provided in this newsletter is accurate and provide valuable information. Nevertheless, the content is used for illustrative purposes only and does not constitute investment advice.
Before you leave…
I kindly welcome your feedback/suggestions/critics, etc to improve its usefulness to you. You can reach me at jramos@u.nus.edu. If you would like to receive the newsletters as they are published please subscribe. I also appreciate it if you share it with your friends who are interested in this space. Thank you.