

#17 Weekly market update (10/01/2022 - 14/01/2022)

Weekly performance:


Key takeaways:
Economic calendar. China will report its GDP growth, industrial production and unemployment rate. The Bank of Japan (BoJ) will provide its view on economic conditions and inflation, which will shape the future of the Nippon monetary policy. The UK will publish the average earnings data, which will be an indication of the British personal income growth. Canada will release its CPI as well as December’s retail sales. In Europe, the CPI of the Euro area will be published and many of its member countries will hold 3Y and 10Y bonds’ auctions. The German ZEW Economic Sentiment Indicator will be released on Tuesday. The ECB will comment on asset purchases and economic conditions on Thursday. In the US, macroeconomic data will play a minor role, with the US 20y auction and Philadelphia Fed Manufacturing Index being the most relevant.
Macroeconomic outlook. The Austrian Central Bank raises its inflation forecast for 2022 from 2.2% to 3.2%. The market is currently attributing a probability of 91.5% that the first rake hike takes place in March 2022. Bank of America expects US Core CPI to peak in March 2022 despite reaching a new four-decade high of +7% YoY. Goldman's Sentiment indicator at the lowest level in 86 weeks, retracing back to its worst since March 2020's collapse. NFIB Small Business Optimism Index reaches a new high, suggesting US SMEs have not been this concerned about inflation since 1981. UMich’s inflation expectations for the next-10 years soars to 3.1%, the highest since January 2011.
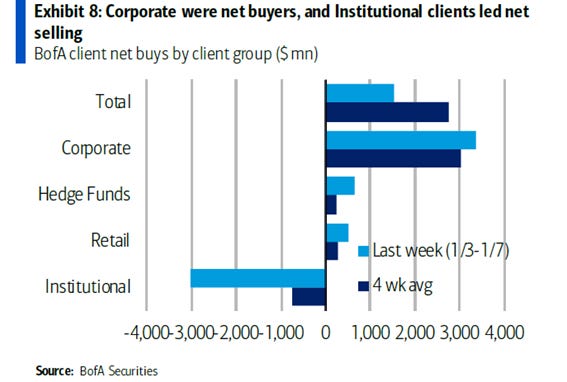
Equities. Marko Kolanovic recommends buying the dip, technology stocks rebound. NASDAQ has suffered the worst drawdown since March 2021. McElligott from Nomura warns of a possible Minsky moment despite quantitative indicators building bullish short-term momentum. Bank of America’s weekly buying volume shows a divergence between incessant corporate buybacks and bearish institutional investors.
Fixed Income. Charlie McElligott identifies CTAs’ excessive bearish sentiment on world major 10Y bonds, warns that a sharp rebound may originate. Powell’s dovishness on the Fed QT timeline boosted Treasuries as investors interpreted inflationary pressure would not make the Fed ignore the other economic effects. US Treasury yields soar after Jamie Dimon expecting 6 or 7 rate hikes to take place in 2022.
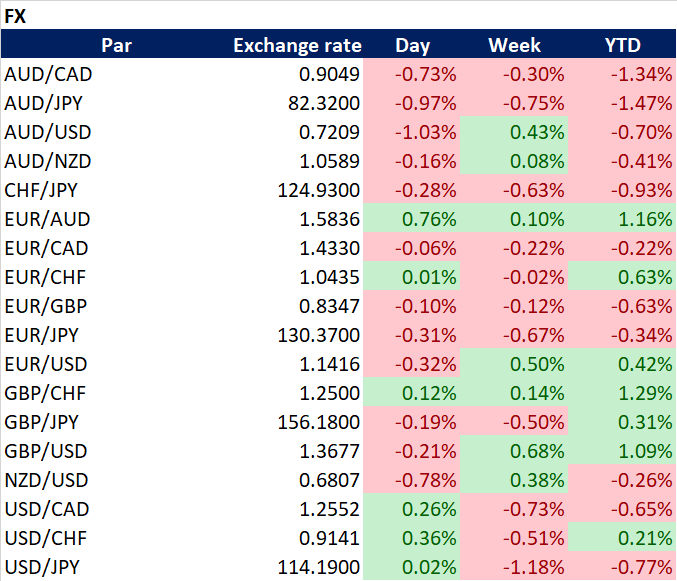
FX. The USD dips against the EUR after the US CPI reading, USD Index may test the 200MA. The Russian Rubble plummets more than 2% against the USD after Putin’s military deployment.
Emerging Markets. China’s CPI reading shows a temporary cooling down with respect to November. The PBoC announces that it may lower the cost of medium-term loans by next week for the first time since April 2020. Goldman Sachs lowers China’s 2022 economic growth forecast to 4.3% from 4.8%.
Commodities. The Green Markets North America Fertilizer Index falls 12%, the sharpest drop since 2009. Total US Crude stocks fall to their lowest since October 2018, oil futures showing strong momentum.
Kolanovic recommends buying the dip on US indices, Nasdaq suffers the worst drawdown since March 2021
Increasing inflation fears brought about bonds, technology (especially unprofitable) to plummet last week. This trend persisted on Monday and Tuesday trading sessions. Nevertheless, NASDAQ strongly rebounded and ended up positive before Tuesday’s closure. As we can appreciate in Figure 1, NASDAQ has suffered the worst drawdown (≈8.2%) since March 2021, when it plummeted by 10% in less than a month. On Tuesday, Marko Kolanovic, JPMorgan’s renowned strategist released a market report recommending buying the dip on US indices. To put things into perspective, the last time he recommended this strategy, NASDAQ initiated a rebound on its 100MA soaring by almost 15% in one month. According to him, higher bond yields should not be a nightmare for equities. Rather, it would reinforce a massive rotation from growth to value. As analysed in #11 Weekly Market Update, Kolanovic already emphasized that most of their clients were more worried by the governments’ reaction than by the Omicron variant itself. He gave some examples of inconsistent measures across countries: “As of today, we can observe restricted air traffic from several African countries where Omicron has not been identified yet. Meanwhile, other European countries that have already reported new cases from the Omicron variant have not interrupted its scheduled flights. He concluded his speech by citing a scientific paper from Gabriela Gomes, which concludes that when old variants propagate thus mutating into new variants, these turn out to be more infectious but with a significantly lower mortality rate. Thus, following this rationale, he still believes that the Omicron variant will progressively be “normalized”, which would bring normality back to markets. He also showed his preference for Emerging Markets, Chinese and European equities in the medium term as a result of the activity improvement and easing headwinds. With regards to the bonds market, they remain bearish in US 10Y Treasuries as they expect further scope for higher yields given still rich valuations and the hawkish shift in Fed expectations. As for the black gold, they reinstate their bullishness given the current strong demand, which should easily absorb the increases in output agreed by OPEC. Finally, Kolanovic keeps recommending being long on USD.

To understand the quantitative market structure, we need to resort to Charlie McElligott from Nomura, who released a new market update on Monday. The cross-asset macro strategist warned of the high probability for a Minsky moment to occur as a result of the economic calendar’s busy week. The main threats to market destabilization were Powell testimony and the CPI release. Before Powell’s testification, the market was already attributing a 91.5% chance of a rate hike to occur by March 2022 (Refer to Figure 2). McElligott believes the bearish sentiment on Treasuries is excessive and a rebound may initiate unless a worse-than-expected CPI print. As observed in Figure 3, the QIS CTA Trend model shows how the net exposure across G10 Bonds is back to a 10-year historical extreme short at just 2.2 percentile overall exposure since 2011. He also states that the market has already priced 3.5 rate hikes during 2022, something which implies that additional losses would discount a fourth hike. Thus, he believes that the Dealer “short Gamma” profile in QQQ ($Gamma -$476mm, 3.4%ile since 2013 - Gamma flip line all the way up at $393.18, ref $377.30) as well as the scaling of the net “negative Delta” (-$21.0B, 1.3%ile) across QQQ strikes may be initiating an abrupt short-term NASDAQ’s strong rebound. Finally, he concludes his paper by analysing the implications of the Fed shifting from QE to QT. When this occurs, excess reserves will drain, which will translate into collaterals (bonds held) needing to find a new home with private investors, which will be simultaneously occurring alongside a reduction in the cash side leading to liquid securities going “poof”. So, essentially, the cost of borrowing rises (repo rates move higher), which in turn impacts risk-free benchmarks as owning government securities becomes more expensive, and this then reverberates out into risk-assets, knocking-on into a widening of spread product like MBS & Credit, which then further spills-over into all parts of the capital structure/securities universe, or what is the same, a Minsky moment. In a nutshell, what he is trying to convey in his stiltedly written paper is that quantitative drivers may be building a bullish short-term momentum that may be soon disrupted by the Fed hawkishness, something which makes me think of a dead cat bounce.


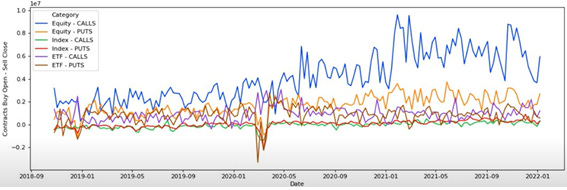
With regards to technical analysis, the NASDAQ shows several indicators highlighting an extreme overselling reaction. Figure 4 illustrates the RSI Indicator, which initiated a buying signal on Tuesday. As we can observe in that same graph, every time this indicator has entered the “oversold” zone, NASDAQ has strongly rebounded during the following weeks. As of Tuesday, NASDAQ is still in short gamma territory, with the flip dealer point being close to the $15,900 level (Refer to Figure 5). It is worth bearing in mind that a negative delta implies higher reactivity, something which translates into wide candles. Moreover, short gamma works both ways. A possible squeeze higher will result in short gamma dealers chasing deltas higher. Something which many investors noticed on the Tuesday trading session is the NASDAQ’s technical chart pin bar. A pin bar is a powerful price action setup concerning price momentum and is usually indicative of an imminent reversal in price direction. A pin bar is a candlestick that has a long wick on one side and a small body. Pin bars may be either bearish or bullish. On this occasion, it was bullish. As observed in Figure 6, during almost the entire trading session, NASDAQ was under high selling pressure, when hours before the closure price was pushed upwards over the day’s open. Moreover, historical evidence suggests that the best pin bars are those that form at areas of technical confluence (e.g. Fibonacci, pivot points, moving averages, etc.), as they provide the ultimate confirmation on a certain price level. In this case, the pin bar appeared really close to the 100MA. Theoretically, if going short on a bearish pin bar, the investor should enter short when the next candle opens and ticks below the low of the bearish pin bar. Conversely, if going long, the investor should initiate a long position when the next candle opens and ticks above the high of the bullish pin bar. Hence, Wednesday’s opening over Tuesday’s high was the confirmation of the bullish signal. At the same time, Wednesday’s strong rebound confirmed another technical pattern known as “morning star”. The CMT Association defines this phenomenon as a bullish candlestick pattern that consists of three candles that have demonstrated the following characteristics: i) The first bar is a large red candlestick located within a defined downtrend; ii) The second bar is a small-bodied candle that closes below the first red bar, and iii) The last bar is a large green candle that opens above the middle candle and closes near the centre of the first bar’s body. In essence, a morning start is normally associated with trend changes, especially when used in conjunction with other technical indicators. In this case, all indicators appear to be tailwinds for QQQ as RSI indicated overselling; QQQ breaks the 100MA; pin bar confirmed. Another important technical driver has been the fact of retail investors’ buying the dip and hoping for a rebound to occur. As observed in Figure 7, there has been a strong spike in the volume of equity calls (especially in the tech, financials and healthcare sectors), something which has been the norm during the last months. We must bear in mind that retail investors are no longer a minority group in the stock market, as they currently represent almost 40% of it. Hence, this may be again another confirmation for the dead cat bounce, especially considering next week’s options expiry date, which is characterized by spikes in volatility during the entire week. Nevertheless, this rebound has also led institutional investors to moderate their bullishness in the financial sector. By analysing the options market, we can observe that the one-month MA of open put options on the Financial Select Sector SPDR ETF outnumbers open calls by a factor of nearly 1.9, being the most bearish ratio since Q1 2020. While some attribute this bet to the incoming earnings season, my take is that it is more about the downside gap risk. From a macroeconomic point of view, the outlook for the banking sector and earnings is strongly favourable, something which demonstrated its last year’s outperformance over the S&P 500 in 2021 (+32% vs. +27%). When it comes to the Bank of America’s weekly buying volume, Figure 8 shows how institutional investors sold $3,000 million (up from $750M), suggesting they are not trusting the rebound. On the other hand, corporate remain with their buybacks programmes uninterrupted (+$3,200M) as we approach the earnings season. Meanwhile, Goldman's Sentiment indicator is at the lowest level in 86 weeks, retracing back to its worst since March 2020's collapse (Refer to Figure 9).


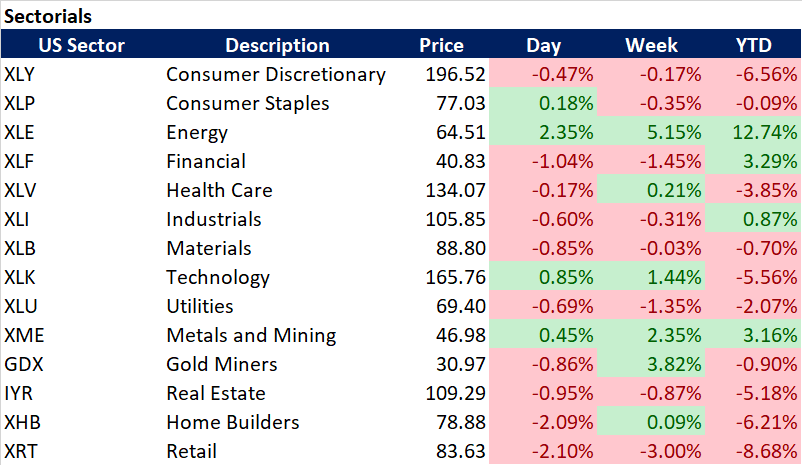
On Tuesday, Jerome Powell testified and showed a more dovish posture on the QT than that of other Fed members during last week’s FOMC meeting. US Treasury yields have soared 20bps MTD and sit at their highest level since January 2020 after the Fed’s hawkish tone of leaving the door open for a reduction of its balance sheet. After the Powell testification, the 10-year Treasury note's yield fell 3.9 basis points to 1.741%. The main takeaway was Powell’s confirmation of “March being an appropriate time to begin hiking rates” and that the Fed would not prioritize inflation reduction above everything else and ignore the other effects that could have on the economy. Until Monday, the extreme rotation from growth to value had been magnified as the longest duration stocks were at risk due to higher interest rates, especially since they remained both expensive and crowded. As a matter of fact, the current January P/B performance spread between the cheapest and most expensive quintiles of stocks was 12%, which ranked in the 98th percentile of the monthly P/B quintile spreads over the last 44 years. To put things into perspective, spreads of this magnitude had only occurred in 8 months in the 44-year period (the tech bubble unwind and the GFC). Nevertheless, when Powell was asked about the quantitative tightening schedule, he stated that the Fed would need between 2 and 4 more meetings to further study the timeline and implications of the balance sheet reduction. As a result, investors perceived Powell’s dovishness as a “buy” signal and Eight of the eleven major S&P 500 sectors rose, with growth-heavy sectors like technology, consumer discretionary, and communications services contributing most to the S&P’s gains, undoing the growth to value rotation. On Friday, after the previous day’s hawkish declarations by many members of the Fed triggered a new sell-off in tech stocks.
US CPI hits a 39-year high at 7%, Bank of America forecasts Core CPI to peak in March 2022
December’s US CPI was released on Wednesday and, despite reaching a 39-year high reading of 7%, investors were not surprised given the low deviation from the consensus (Refer to Figures 10 & 11). By decomposing the CPI data, we can easily appreciate that there has been a significant improvement in MoM, not only because of the decrease in the energy prices (which will not be the case in January) but also in other crucial components namely food (See Figure 12). Nevertheless, we can identify several takeaways from this reading. First, the Green Markets North America Fertilizer Index fell 12%, something which did not occur since 2009(Refer to Figure 13). Despite fertilizer markets are currently immersed in a battle between emotion and fundamentals, the latest plummeting favours a decrease in the price of food, which has suffered significant inflationary pressures during October and November. Second, other components do not suggest inflation is expected to rebound in the short term. As observed in Figure 14, the Manheim Used Vehicle Index has reached a new high at 236.2. Having increased 3.5% YoY, this item is currently reflecting the persistence of the supply chain bottlenecks. Another striking data is the steady increase in shelter inflation, which has risen to 4.13% YoY from 3.84% (See Figure 15). To put things into perspective, this increase has been the highest since February 2007. Finally, something to bear in mind is that the average citizen is seeing its worth erode. Figure 16 shows how the real average hourly earnings have been falling for the 9th straight month, with December accounting for -2.4% YoY. As a result, it may not be surprising seeing the NFIB Small Business Optimism Index reached a new high, suggesting that US small businesses haven’t been this concerned about inflation since 1981 (Refer to Figure 17). On that same day, Bank of America released a paper analysing inflation and stated that the breadth of the inflation supports the Fed’s call for four rate hikes this year, along with the start of the quantitative tightening. Overall, they expect core inflation to peak in the next 2 to 3 readings, that is, March 2022, as the YoY comparisons will turn highly unfavourable. Finally, they challenged the Fed’s 2022 target forecast of 2% by betting for CPI being closer to 3%. expects it to peak in the next 2 to 3 readings.


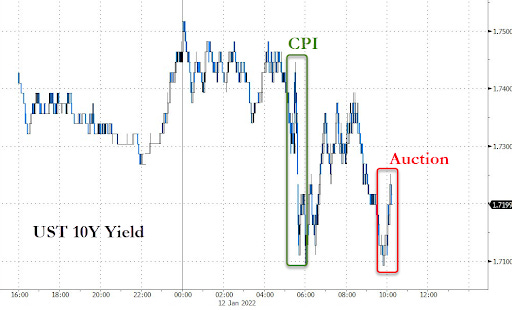
But how did markets react to the CPI reading? By far, one of the most violent movements was the appreciation of the EUR against the USD, which confirmed the breakage of the 50MA and closed the trading session with a gain of 0.66% (See Figure 18). When it comes to fixed income, the previous day’s US 3Y auction reinforced the view that there is no way that the Fed will be able to pull off 4 (or even 3) rate hikes in 2022 while starting QT. The first auction of 2022 went better than expected ($52bn sold) and demonstrated strong demand for Treasuries despite the consensus of 3 or 4 rate hikes during 2022. US 3Y yields plummeted, something which benefited equities. The same occurred with Thursday’s US30Y auction, which showed strong demand and brought about yields to moderately decrease to the 2.06 level (See Figure 19). Nevertheless, the US10Y auction was not as bullish as that of the US3Y Treasuries (bid to cover of 2.51 modestly above December's 2.43 and was right on top of the 2.50 6-auction average) and brought about yields to soar again to 1.735% (Refer to Figure 20). Similarly, Charlie McElligott from Nomura warned of the extreme bearish sentiment by CTAs, who are 100% short on all major 10Y bonds, except for the UK, whose short positions now account for 66% (See Figure 21). As observed in that same figure, CTAs would shift to long in US 10Y Treasuries at 130.37, still far at 128.359. JP Morgan also confirmed that its clients are the most bearish in bonds since 2017. As a result, this negative sentiment may initiate a short-covering reaction which would translate into a sharp rebound. Similarly, JP Morgan also analysed the CTAs positions in world major indices and observed that they would close their long positions if the futures of the S&P 500 and NASDAQ 100 cross the $4,466.4 and $15,292.1, respectively. On Friday, Jamie Dimon, the chairman and CEO of JP Morgan, stated that there could be six or seven rate hikes in 2022, which would significantly differ from the consensus of 4. As a result, US 10Y Treasury yields soared to 1.76%. Nevertheless, some analysts believe the Fed may not be fully independent to act, partially affected by the increasing disapproval of the Biden administration (Refer to Figure 22). Something worth commenting on is a geopolitical piece of news on Thursday that brought about NASDAQ and SPX to close below the opening price. The latter was close to the $4,736 level when Bloomberg announced Putin would provide military support to Venezuela and Cuba as a reprimand to the US. Soon after the news, the SPX and the NASDAQ plummeted 155 and 273 bps, respectively (Refer to Figures 23 & 24). It is worth bearing in mind that the option expiry date is approaching, and, as this is usually the case, Thursday’s plummeting may have had something to do with it. In any case, by analysing the Dark Index Indicator, we can observe that there was no signal indicating panic selling (Refer to Figure 25).


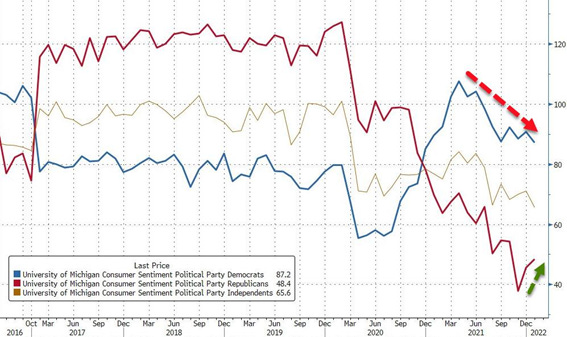
Another important US macroeconomic data was released on Friday. The University of Michigan’s Consumer Sentiment Index showed a worse than expected outlook in terms of current economic conditions and consumer expectations after December’s rebound (Refer to Figure 26). Actually, current conditions reported were the worse since September 2011, and only 3 of every 10 households expect an improvement in the economic conditions during 2022. When segregating the sentiment by political party, we can see the gap between Democrats and Republicans has significantly compressed after the strong rebound of the latter group (See Figure 27). But if there is something striking in this latest report is the increasingly worrying perception of inflation by Main Street. As we can see in Figure 28, buying conditions for vehicles has reached a new record low coinciding with the new high registered by the Manheim Used Vehicle Index. Similarly, inflation expectations for the next 5-10 years have soared to 3.1%, the highest since January 2011 (Refer to Figure 29). When it comes to this year, the median response accounts for 4.9%, more than double the Fed’s target.


Also, throughout the week, several analysts have studied the performance of equities after the first rate hike. Figure 30 shows Ryan Detrick’s report analysing the SPX performance when the Fed hiked interest rates since 1983. As observed, the median return is slightly positive during the first three months (0.5%), but it is maximized half a year after the rate hike takes place (6.5%). Nevertheless, on each of the occasions, the SPX has concluded the next twelve months in positive, with an average return of 10.8%. By applying this analysis to the S&P 500 sectors, we can see that technology is, by far the best-performing industry during those cycles with an average annualized return of 20.6%. Real estate and energy are the second and third most favoured sectors with AARs of 12.0 and 11.9%, respectively (Refer to Figure 31).


Total US Crude stocks fall to their lowest since October 2018
Oil has had a positive start to 2022 as a result of both expectations of its demand expected to increase given the pandemic’s impact on fuel consumption and the geopolitical upheavals in OPEC+ member countries (e.g., Kazakhstan and Libya). This week’s crude inventories have shown a decrease for the 7th straight week, reaching a new low since October 2018. Bloomberg Intelligence's Senior Energy Analyst Vince Piazza notes that despite OPEC+’s pledge to increase production for January and next month, he expects the cartel to add less to the market than planned. Figure 32 shows how the US oil production has moderately decreased during the first week of the year. Consequently, WTI and Brent Crude Oil futures have strongly rebounded from December lows (See Figure 33). This bullish trend will undoubtedly be reflected in January’s US CPI as, according to some analysts, the average US citizen may pay around $4 per gallon by spring. The most affected cities would be San Francisco and other California metro areas, where the price per gallon could reach as much as $5.65 per gallon. During the second half of 2022, the increasing pressure in the price of gasoline may start to cool down.


December’s Chinese inflation cools down, the PBoC may initiate rate cuts
On Tuesday, the National Bureau of Statistics of China released December’s CPI, which showed a substantial decrease with respect to the month of November (+1.5% YoY vs. +2.3% prev.). When it comes to the Core CPI, it fell below 0 for the first time since June 2021 (Refer to Figure 34). Similarly, December’s Chinese PPI dropped to +10.3% YoY from +12.9%, mainly as a result of the easing pressure in commodity prices (See Figure 35). As analysed in #05 Weekly Market Update, the decreasing industrial profits for Chinese businesses suggests that the producers seem to be absorbing the higher costs, instead of passing these to consumers, which would result in a higher CPI reading (Refer to Figure 36). Nevertheless, China’s “Zero Covid” policy, which strictly restricts mobility, may temporarily drive prices up due to supply-side pressures, which will undoubtedly be aggravated by the upcoming Lunar New Year holiday. During this period, it’s not uncommon to see an exponential increase in the demand for consumer staples, which consequently drives prices up. In any case, the PBoC has announced that it may lower the cost of medium-term loans by next week in order to cope with the weakening private consumption and the property market slowdown (See Figure 37). The hypothetical cut of 5-10 bps would be the first since April 2020. Goldman Sachs has cut China’s 2022 economic growth forecast to 4.3% from 4.8%.


Disclaimer: I have done my best to ensure that the information provided in this newsletter is accurate and provide valuable information. Nevertheless, the content is used for illustrative purposes only and does not constitute investment advice.
Before you leave…
I kindly welcome your feedback/suggestions/critics, etc to improve its usefulness to you. You can reach me at jramos@u.nus.edu. If you would like to receive the newsletters as they are published please subscribe. I also appreciate it if you share it with your friends who are interested in this space. Thank you.