

#18 Weekly market update (17/01/2022 - 21/01/2022)

Weekly performance:


Key takeaways:
Economic calendar. Australia will report its Manufacturing and Services PMIs, CPI and December’s NAB Business Confidence reading. After Germany’s highest PPI since the end of WWII, Spain, Italy and South Africa will publish December’s data. Several countries of the Euro area, namely Germany and France, will report their GDP as well as their Manufacturing and Services PMIs. European bonds may react to Italy, Germany, France’s 10Y auction. In Asia, Japan will publish its CPI, retail sales and industrial production. In the US, all eyes are on Wednesday’s FOMC Press Conference and the Fed’s Interest Rate Decision. Other relevant economic data includes the GDP, PCE, goods trade balance, CB’s consumer confidence indicator. The Bank of Canada (BoC) will also hold a press conference with regards to its monetary policy and its decision on interest rates.
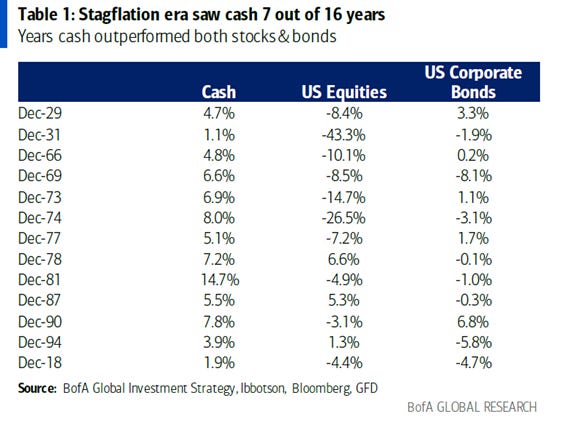
Macroeconomic outlook. BofA’s Global Fund Manager Survey shows hawkish response by the Fed to be the biggest tail risk as of January 2022. December’s Euro area CPI reaches 5%, the highest since the creation of the Euro. Germany’s PPI has soared to +24.2% YoY, reaching a new all-time high. Deutsche Bank expects the Fed to begin raising rates at each meeting from March onwards, starting the QT during Q2. 50-50% of portfolios have yielded negative returns during the last 3 weeks. Michael Hartnett warns that cash has beaten equities and bonds in 7 out of the 16 years during stagflation (e.g., 1966-1981 period). US NY Empire State Manufacturing Index plummets to -0.7%, contracting for the first time since Q2 2020.
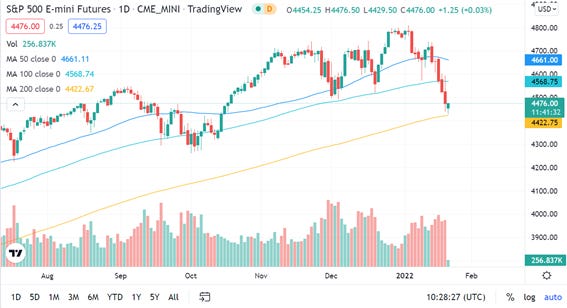
Equities. SPX to test its 200MA, something it did not occur since July 2020. Friday’s OPEX has brought about some market turbulences, aggravated by changes in CTAs positions and the underlying assets’ sales from market makers. Banks, insurance, and industrials remain as the most overweighted sectors, while technology has gone from top-3 to underweight for the first time since 2018. Friday’s OPEX has been the biggest in volume since January 2021, with $125bn deep in-the-money calls expiring.
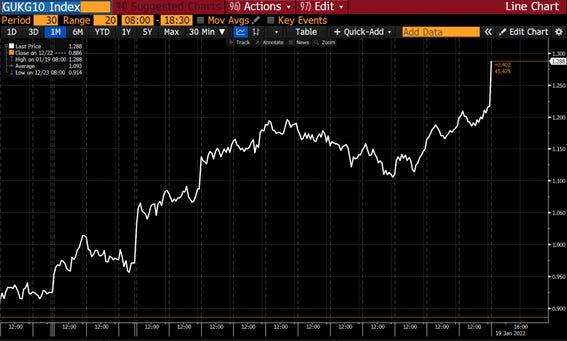
Fixed Income. US30-5 Year Spread is back to pre-Covid levels, suggesting difficult times for growth. Bond prices reflect investors’ distrust of the Fed’s late intervention, suggesting that by the time it intervenes, inflation may have naturally peaked, and growth may be significantly lower than the current. The 10Y German bund trading back in positive, something which did not occur since May 2019. British 10Y Gilts reach their highest since March 2019 as UK’s CPI hit a new 30-year high. McElligott considers the US 10Y Treasury’s $127 level to be crucial, warns of massive put volume which leaves the potential for a “short gamma” event growing substantially on Dealer hedging “accelerant” flows.
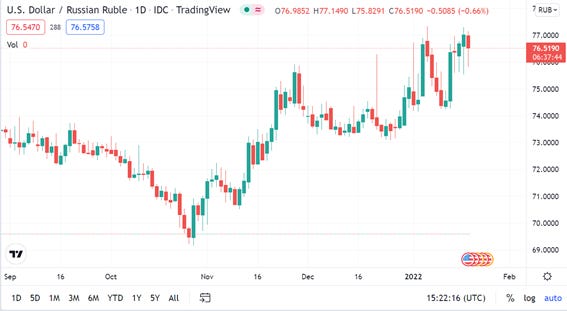
FX. The USD cumulates an appreciation of more than 10% since October 2021 against the Russian Ruble. CNY appreciates against the USD after China’s strong trade balance data.
Emerging Markets. Massive sell-off on the Russian ETF ($RSX), as geopolitical tensions rise. The PBoC cuts its one and five-year loan prime rates to foster credit supply amid weakening economic indicators. China’s GDP grows at the fastest pace of the last ten years, data distorted by a weak base last year.
Commodities. Palladium soars 11% after rising tensions with Russia, the biggest producer accounting for 37% of the total world supply.
January’s BofA Global Fund Manager Surveys shows investors have high hopes for European markets
BofA has recently published its monthly survey to 374 fund managers, with a combined $1.2 trillion in AUM. Despite the results representing a mere opinion, some interesting facts may be observed.
When it comes to risk assessment, 44% of the respondents consider the Fed’s hawkishness to be the biggest tail risk, double the amount of those perceiving such a threat by November 2021 (Refer to Figure 1). As a matter of fact, almost 7 of every 10 US asset managers consider the current monetary policy as extremely dovish. Nevertheless, only slightly more than half of European asset managers do agree with this statement. Another interesting finding is the progressive decrease in inflation fears, 21% of asset managers cite it as the main risk (vs. 33% November 2021). As for Covid, the perception is back to that of November, when the Omicron variant had not even appeared. Similarly, other risks like US-China geopolitics may be related to the rising tension across the world’s major economic powers, and chances are Russia’s military threats will stand alone as a single risk in next months’ survey. Yet, none of these risks discourages investors from aiming high in 2022. More than 80% of the respondents expect European equities to soar 5-10% this year. Moreover, 39% of the asset managers (vs. 28% prev.) forecast European equities being bullish until at least, Q4 2022. When asked whether the market has reached its peak, only 10% of all respondents replied affirmatively. By sectors, investors remain bullish in cyclicals, as 47% of the asset managers considers European cyclical companies to outperform defensives. Banks, insurance, and industrials remain as the most overweighted sectors, while technology went from top-3 to underweight for the first time since 2018 (See Figure 2). To put things into perspective, the number of investors bullish on banks has reached a new all-time high, while that on insurance has reached 2014 levels. On the other hand, the least preferred sectors are telecommunications, healthcare, and public services. Finally, the most preferred European markets are Germany, the United Kingdom and Italy. Conversely, Switzerland and Spain consensus has significantly deteriorated MoM (See Figure 3).


US Treasuries yields soar in the week of the options expiry date, pricing a more hawkish Fed’s intervention
Undoubtedly, this week has been marked by the options expiry date, which according to Spotgamma, it could be the biggest in volume since January 2021. As analysed in prior Weekly Market Updates, in most months of 2021, the SPX has undergone some turbulences as the option expiry date approached. As retail investors buy call options, institutional investors are short on calls and, at the same time, they need to buy the underlying asset to hedge the put. When the options expiry date approaches, most of these calls are out of the money, and thus, institutional investors sell the underlying to undo its hedge, something which explains the origination of the above-mentioned turbulences. This month, numerous deep in-the-money calls worth $125bn have expired (Refer to Figure 4). We must bear in mind that these calls are unique because they are valued as being essentially equivalent to shares of stock (referred to as Delta 1 position). Most of these were bought in 2021 and have participated in the massive stock rally over the last year. But, who owns these long-dated calls? From hedge funds to retail investors, to Nancy Pelosi, these players have gained levered exposure to higher stock prices through calls, while limiting downside risk. Some of the names in play are $APPL; $MSFT; $TSLA; $FB; $GOOGL; or $AMZN, among others. Acknowledging the functioning of the options expiry date, ARKK ETF could be one of the most affected when some of these stocks come for sale. This may also explain the drastic shift in sentiment towards the technology sector reflected in BofA’s Global Fund Manager Survey. By analysing the January 2021’s options expiry date, we can easily identify two main market reactions. First, the SPX remained flat until March, when initiated a strong bull run, especially during April (See Figure 5). Second, some days after the January OPEX, the GME Mania kicked off, a movement that brought about margin calls to many hedge funds, including Melvin Capital, which has been 2021’s worst-performing hedge fund with a return of -41.5%.


But if there is something that has affected the performance of equities this week, this has been US Treasuries. On Monday the US 2Y Treasury yields soared 3.6bps, exceeding 1% for the first time since February 2020. Similarly, US 10Y bonds yields reached the 1.85% level. The catalyst for these sharp movements has to do with the consensus on the Fed intervention. With markets currently pricing 4 rate hikes by December 2022, the market-implied number of rate-hikes by March 2022 now sits at 1.211, suggesting that the Fed may hike rates by 50bps - instead of 25bps – (Refer to Figure 6). A significant number of renowned analysts have warned of this more hawkish Fed’s reaction. Peter Hooper, Deutsche Bank’s global head of economic research stated that there’s every likelihood that the Fed begins to raise rates at each meeting from March onwards. Moreover, he expects QE to be completed by March and start the QT during Q2. As a matter of fact, yield curves keep flattening at a vertiginous speed. As we can observe in Figure 7, the US30-5 Year Spread is back to pre-Covid levels, something which clearly reflects that growth is going to undergo difficult times. In my opinion, what bond prices may be pricing is the Fed’s inability to cope with the situation. On the one hand, the latest US CPI reading accounted for the highest in the last four decades. We must bear in mind that this rising inflation is being induced by a supply-side shock, which is at the same time boosted by the excess of liquidity draining the system. Similarly, both growth rate projections and indicators are showing a deteriorating economic situation. Some examples of the latter may be the Citi Economic Surprise Index, which has now sunk to negative or the US Empire State Manufacturing Survey General Conditions Index (See Figures 8 & 9). While the US economy is mainly fuelled by the tertiary sector, manufacturing is still a strong determinant of its economic performance. After showing a reading of -0.7%, this has been the first contraction in NY manufacturing activity since the second quarter of 2020, as demand for goods declined amid the spread of the omicron coronavirus variant. As a result, bonds may be reflecting investors distrust of the Fed’s late intervention, suggesting that by the time it intervenes, inflation may have naturally peaked, and growth may be significantly lower than the current. In other words, we may be immersed into a stagflation period by the time the Fed intervenes, a term to which Michael Hartnett has referred since mid-2020. This week, BofA’s Global Chief Investment Strategist warned that cash might be more profitable than equities and bonds. As a matter of fact, 50-50% portfolios have yielded negative returns during the last 15 days. While cash has rarely yielded higher returns than equities and credit during the last 30 years, this has not been the case during stagflation (e.g., 1966-1981 period), where cash beat equities and bonds in 7 of the 16 years. Since 1929, this phenomenon has occurred 13 times, 7 of which during periods with high inflation (Refer to Figure 10). In retrospect, we can affirm that inflation has always preceded recessions. The recession of the late 60s was preceded by consumer goods’ inflation. Similarly, the 1973-74 crisis was driven by the skyrocketing prices of oil and food. Six years later, soaring oil prices brought about a new crisis. Others like in 2000 and 2008, were caused by the tech and real estate bubbles, respectively. Hartnett concludes by stating that the Fed’s late intervention will lead to a recession. According to him, the Fed should rate 50bps in January’s meeting. While he believes this would be the most efficient response, he acknowledges that the Fed will avoid such an abrupt movement to avoid originating a market crash.


In any case, this week has left us with several observations about the different players’ flows. If we analyse the weekly performance of the US major indexes, we can see that the S&P 500, NASDAQ, and Russell 2000 have yielded negative returns (Refer to Figures 11, 12 & 13). While at first sight may look like a simple correction, there are several indicators not only revealing whose money is flowing out but also some divergences. Figures 14 & 15 show the Dark Pool Indicator and the Market-on-Close (MoC) order imbalance, respectively. As we can see, none of these suggests selling pressure, as in other market corrections, and, as a matter of fact, the MoC has shown net buying imbalance in 16 out of the last 20 trading sessions. In order to identify the market agents with a different reading, I have resorted to Charlie McElligott’s report and the CBOE Skew Index. When it comes to the former, renowned Nomura’s quant analyst observed two main drivers: Fixed Income and CTAs positions. With regards to the bonds market, one of the news of the week has been the fact of the 10-year German bund trading back in positive, something which did not occur since May 2019 (See Figure 16). It is worth bearing in mind that real yields remain negative. Similarly, the British 10-Y Gilts have now reached their highest since March 2019 as UK’s CPI reflected a new 30-year high (Refer to Figure 17). Therefore, the US markets are no exception and Charlie McElligott warned that the US 10Y Treasury’s $127 level is crucial, given the massive put volume which leaves the potential for a “short gamma” event growing substantially on Dealer hedging “accelerant” flows (See Figure 18). My take is that the US 10-Y will hit 2%, but the selloff will slow down by then. Actually, I am inclined to believe that if this level is surpassed, the Fed won’t tolerate it and will engineer something. When it comes to the CTA positions, McElligott observed that they have shifted from 100% long to 37% short in NASDAQ, which translates into an aggregated sale of ≈$17,600M. From Figure 19, we can also see that CTAs would shift to long when the NASDAQ (spot) reaches $15,319.2, not so far from the current level. As for the Russell 2000, which cumulates one entire month with net short positions, CTAs have now shifted to 100% short and would shift to long when its spot reaches $2,073.45. On the other hand, as of Wednesday they remain 100% long on the S&P 500 as well as on the main European Indexes. If we observe Figure 19, the level at which CTAs would sell was $4,507.96, a level which was trespassed on Thursday’s session. As a result, they may have initiated a 37% short position. It is worth bearing in mind that the S&P 500 In essence, Thursday’s session was mainly driven by technical, rather than panic-selling created by CTAs’ position changes. From the CBOE Skew Index, we can also observe that market makers have been selling the underlying assets in wake of the OPEX, something which has prevented the SPX to remain afloat at the $4,550 level. As analysed in #15 Weekly Market Update, the SKEW Index is derived from the prices of OTM options and measures perceived tail-risk in the S&P 500 or, said in other words, events whose probability of occurrence equals 0.3%. According to empirical studies, a typical range in the SKEW Index is anywhere between 100 and 150. As observed in Figure 20, it now sits slightly at 134, suggesting institutional investors are undoing its hedges. At this level, the estimated probability of 30-day S&P 500 returns to be 2 and 3 standard deviations below the mean equal 13.3% and 1.9%, respectively. As a rule of thumb, each five-point move in the SKEW Index adds or subtracts about 1.3 or 1.4 percentage points to the risk of a two standard deviation move. A five-point move adds or subtracts approximately 0.3 percentage points to a three-standard deviation move.


Geopolitics may be responsible for another black swan
As analysed in #17 Weekly Market Update, the Ukraine-Russia conflict was ignored and significantly underestimated in most of the weekly market reports. Cumulating a drawdown of almost 30% (12% YTD) since the resurgence of the ongoing military confrontation between Ukraine and Russia in October 2021, the Russian ETF ($RSX) has been suffered a massive sell-off by investors, who are starting to worry about a possible escalation of the crisis (Refer to Figure 21). Similarly, the USD has appreciated by more than 10% (3.19% YTD) since late October 2021 (See Figure 22). In the last few days, several Western nations have threatened with a list of potential sanctions against Russia in case they invaded its neighbouring country. Russia, which is the biggest producer of many commodities, has mobilized hundreds of thousands of troops (Refer to Figure 23). The sanctions range from preventing Russia from using the SWIFT messaging system used for financial transactions to banning Russian banks from trading in USD to initiating firm-specific coordinated boycotts. Countries like Canada have already pronounced and asked citizens to avoid non-essential travel to Ukraine due to “Russian aggression”. The European Union’s strong dependence on Russian gas (31% of total gas imported) has placed the block between the Devil and the deep blue sea. Several members of the EU have asked for dialogue, mainly incentivized by the terrible consequences it may have on European citizens’ pockets were inflation to spike after a hypothetical interruption of gas flows from Russia. To put things into perspective, December’s Euro area CPI reached 5%, the highest since the creation of the Euro. Nevertheless, there are wild regional differences. Eastern Europe is being hit particularly hard hit by runaway food prices. Inflation breached the two-digit threshold to reach 10.7% in December in Lithuania, the second-highest rate in the EU, largely driven by a spectacular rise in energy prices. Other countries like Germany have also suffered from rising inflation. December’s German PPI has soared to +24.2% YoY, translating into the highest increase since 1949, when the first stats were created after the Second World War (Refer to Figure 24).
Thursday appeared to be a rebound session but, as soon as the news of the US declaring that it would facilitate army equipment and ammunition to the Baltic countries to protect from Russia, the US major indexes plummeted. As a matter of fact, the NASDAQ fell 3% from its intraday high to its low. Historically, the tech index had never erased an intraday gain of 1% and closed lower by 1% in the last twenty years. The SPX, which would return to positive gamma at $4,665, also followed suit. Despite the immediate market plummeting reflected the extreme reactivity of markets to the ongoing geopolitical crisis, the CTAs aggravated the situation by liquidating their positions when the $4,507.96 level was crossed. Moreover, market makers were also selling the underlying assets before the OPEX. From a panoramic point of view, divergences remain and as observed in Figure 25, there is a significant difference between the drawdowns of broad indexes compared to that of its single components. Some of these severe drawdowns have been suffered by most of the NASDAQ components, given the recent extreme selling pressure on QQQ. Nevertheless, during this week there has been the biggest inflow ever, which suggests that the law of contrarian sentiment may bring about a rebound (See Figure 26).


Macroeconomic data suggests the Chinese economy is cooling down, the PBoC cuts rates for the first time since April 2020
As analysed in #17 Weekly Market Update, chances were the PBoC could lower interest rates by 5-10 bps during this week. On Monday, the rumour became official after the People’s Bank of China announced a 10 bps cut to 2.85% on its one-year policy loans. Undoubtedly, this contrarian move fostering policy easing to encourage credit supply suggests that the Chinese economy is weakening. As a matter of fact, this hypothesis could be confirmed after the release of the GDP data corresponding to the fourth quarter. Despite China’s GDP having grown by 8.1% YoY, 2021’s growth has been mainly distorted by the exponential increase in Q1, given the weak base last year, which has, in turn, resulted in 2021 being the year with the faster growth in the last ten years (Refer to Figure 27). Nevertheless, by analysing quarterly data we can easily observe that GDP growth for Q4 is significantly falling behind that of pre-Covid, and even worse than the economic growth registered in the last quarter of 2020 (See Figure 28). Accounting for +4% YoY, the official data has beaten the excessively pessimistic consensus of +3.3%. Similarly, the central bank also lowered by 10 bps the rate on the seven-day reverse repo to 2.1%. Another disappointing data was that of retail sales, which missed expectations with just an increase of 1.7% YoY (Refer to Figure 29). Even online retail sales grew by “only” 14.1% in 2021, the slowest annual pace since 2014. The drivers of such underperformance are closely related to the zero-Covid strategy, especially with the incoming Winter Olympic Games, which has undoubtedly altered social interaction. Despite some analysts claiming that the Lunar New Year holidays may boost the next months’ retail sales and the services sector, it is worth bearing in mind that 2021 would be a weak base year. Another important consideration is that the high transmissibility of the Omicron variant may challenge the zero-Covid strategy. Yet, this strategy has proved to be beneficial to China’s value-added industrial output, which has grown by 9.6% during 2021. The country’s effective outbreak prevention and control work has enabled China to maintain the stable operation of its industrial chains. By sectors, the primary industry has grown by 7.1%; the secondary industry has expanded 8.2%, and the tertiary industry has soared 8.2%. In a nutshell, the main macroeconomic drivers of the Chinese economy (GDP Growth; Industrial Production; Retail Sales; Fixed Asset Investment; and Property Investment) have significantly deteriorated in this year, a trend which is likely to persist throughout 2022.


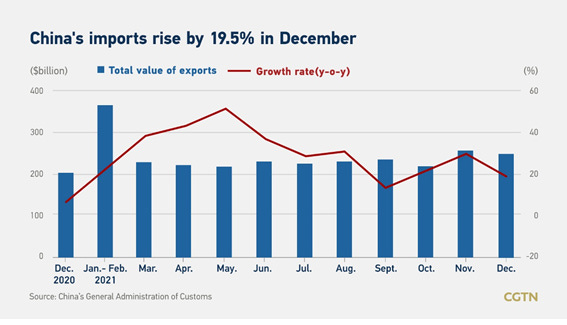
Nevertheless, the CNY appreciated against the USD after the strong trade balance reported by China and the confirmation of its international partners’ dependence on their exports (See Figure 30). China's foreign trade volume reached $6.05 trillion in 2021, surpassing the $6 trillion mark for the first time. With regards to 2021’s exports and imports, they hit 29.9% and 30.1%, respectively. As we can observe in Figure 31, December’s exports growth beat consensus 20.9% vs. 20%, demonstrating strong overseas demand for goods, despite the slowing growth rate. Similarly, December’s imports soared by 19.5% YoY (31.7% prev), missing forecasts of 26.3% (See Figure 32). The main takeaway from the trade balance data is the new milestone achieved on the routes related to the Belt and Road Initiative. Chinese trade with countries along these routes increased by 23.5% in 2021. Similarly, expectations are quite high with regards to the new Regional Comprehensive Economic Partnership with ASEAN, which took effect on January 1, 2022. Chinese analysts expect China to consolidate its role as a major exporter of machinery, labour protection products and industrial intermediates, given ASEAN countries’ infrastructure investment plans to boost their economies.


The biggest news came on Thursday when the PBoC announced a new cut on its benchmark lending rate for the second consecutive month. Despite the central bank had already lowered its mortgage reference rate on Monday for the first time in nearly two years, the one-year and five-year loan prime rates were also cut from 3.80% to 3.7% and from 4.65% to 4.6%, respectively, increasing PBoC’s efforts to push down borrowing costs. As a result, Chinese tech equities, which had been hammered during 2021, strongly rebounded with the Hang Seng Index soaring more than 3% (Refer to Figure 33). As a matter of fact, there was a clear rotation from NASDAQ to Hang Seng during Thursday’s session (See Figure 34).


Disclaimer: I have done my best to ensure that the information provided in this newsletter is accurate and provide valuable information. Nevertheless, the content is used for illustrative purposes only and does not constitute investment advice.
Before you leave…
I kindly welcome your feedback/suggestions/critics, etc to improve its usefulness to you. You can reach me at jramos@u.nus.edu. If you would like to receive the newsletters as they are published please subscribe. I also appreciate it if you share it with your friends who are interested in this space. Thank you.